Northern Economist 2.0

Thursday 1 April 2021

Yes Councillor! Municipal Costs in Thunder Bay Are Higher But Let Us Explain...


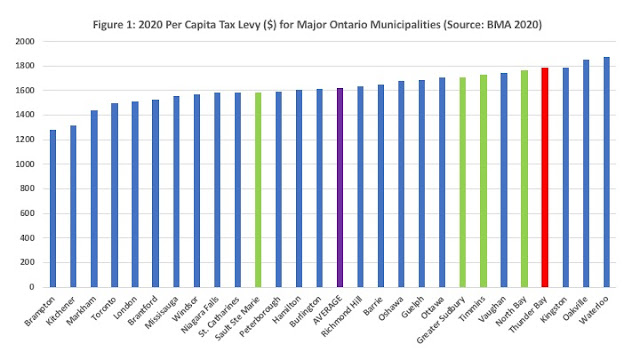
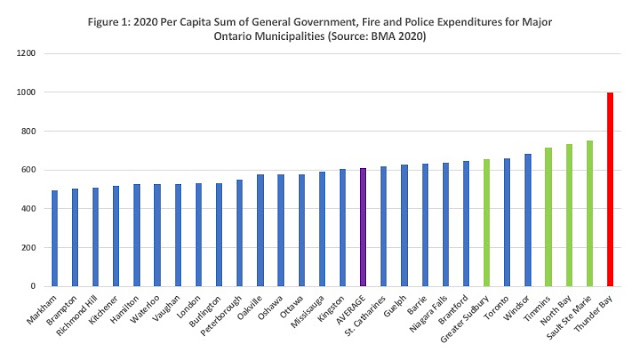
Thunder Bay spends one of the highest per capita amounts of major Ontario cities.  Moreover, it has chosen to prioritize three things: general government, police, and fire services.  Indeed, of 27 major Ontario municipalities, Thunder Bay spends the most per capita of its tax levy supported operating budget on these three things as illustrated in Figure 1.  Indeed, nearly 60 percent of Thunder Bay’s operating tax levy is spent on these three items.  Naturally, what it also implies is that there is less to spend on everything else and in fact, while Thunder Bay spends one of the highest amounts per capita and the most on general government, police and fire, it actually spends a lot less on everything else compared to these other cities.


Now, if I were a Thunder Bay city administrator tasked with addressing  the above statements in response to a query by a municipal councillor, I would naturally respond by saying that yes indeed, councillor, the numbers are higher but they really do not tell the entire story because in Thunder Bay ‘general government’ is a broader and more encompassing term of innumerable complexities compared to other municipalities that are located in more densely populated and less policy challenged parts of the province.  As well, I might even venture that perhaps Thunder Bay includes costs in general government that other cities do not as part of its own diverse and unique circumstances reflecting its special position as a northern municipality with serious social and economic issues of the utmost seriousness that in the fullness of time must be very seriously addressed.


Of course, that begs the question as to why the composition of the numbers that have been used in the above comparisons - which come from the BMA Municipal Report – would be so different given that they are supposed to be constructed and provided to allow for some type of standardized comparisons?  Needless to say, at this point as a City Administrator I would probably respectfully argue that these are complex questions beyond the pale of the councillor's valuable time given their plethora of pressing duties and ultimately requiring further study by knowledgeable and qualified individuals with intimate knowledge of local realities.  If pressed for details on the composition of general government spending in Thunder Bay, I would certainly take the request into consideration and get back at some future date as providing the data requires substantial resource expenditures given its all-encompassing complexity.


So, we are left to our own devices. In addressing the higher costs of certain municipal expenditures in Thunder Bay, perhaps we can focus on something more specific and better defined rather than something as amorphous as ‘general government’.  Why not policing or fire?  Figure 2 provides a first ranking of policing by presenting the number of police officers per 100,000 population obtained from Statistics Canada for 15 major Ontario centres in 2019 (with Hamilton only available up to 2017).  It turns out that Thunder Bay does not have the highest numbers of officers per capita of these 15 cities. It is tied with Windsor at about 205 officers per capita.  


No doubt there are extenuating circumstances as to why Windsor has so many officers. -perhaps there is more crime in border cities with a lot of casinos.  Thunder Bay is a border city – well almost – but it is very close to the border.  And we have a casino too.  Lo and behold, Thunder Bay, also has a lot of crime so we must be like Windsor after all.   And as for Ottawa which has so many fewer officers, it is the seat of government and also has innumerable other security forces such as our military and the RCMP which allow the municipality to spend less on policing.  If only Thunder Bay could be blessed with a Canadian Forces base or perhaps a branch office of CSIS, we would be a more secure place.  Moreover, Ottawa is inhabited largely by peaceful civil servants and government sector workers so it must be a more law-abiding town, right?  But wait, Thunder Bay has over 30 percent of its employment in the broader public sector – not as high as Ottawa but still very high by provincial standards - so why no spillover into crime statistics?


Of course, the number of officers may be correlated with cost but perhaps policing resources in Thunder Bay are abundant because we pay officers less and therefore, we are getting more bang for our buck?  Well, Figure 3 looks at the cost of policing for these same 15 major Ontario centres using cost measures from the BMA 2020 Municipal Report.  The cost measure is what is available – the cost of policing in terms of dollars spent on policing per $100,000 of tax assessment.  Using this measure, Thunder Bay comes in third place – behind Windsor and Timmins – at $439 per $100,000 of taxable assessment.  Put another way, in Thunder Bay, if you have a $250,000 home, you are probably paying close to $4,000 in property taxes on that home.  Of that amount, $1098 (2.5 times 439) is going to pay your share of police services – about 28 percent of your taxes.  In other words, in Thunder Bay, one-quarter of the tax levy goes to provide policing services. A good question is how this might compare to other cities but good luck conveniently getting the data for that.


Are there good reasons why we spend a lot on policing in Thunder Bay. Yes, councillor, maybe.  Or, maybe not. However, relying on the City of Thunder Bay to make the case rather than a more impartial source probably results in a predetermined answer. It still does not change the fact that we are at the top of the list both in terms of policing numbers per capita and in costs as measured by the publicly available data.  Does that mean we need do nothing about it? No. We can always do better.  That does not mean spending more on policing, it means finding ways to achieve current outcomes with less money.

Sunday 17 January 2021

Thunder Bay Simply Spends More...A Lot More


Budget deliberations will continue this week at Thunder Bay City Council and the conversation to date suggests that there does seem to be some recognition that this year needs to recognize the financial hardship of the current pandemic.  However, easing back on tax increases this year and expecting to get back to normal the year after is really also not the right strategy.  This does seem to be the source of division right now on Council given the difference of opinion on just how serious future financial challenges are.


The summer saw talk of a tax levy in the 3-6  percent range as a result of increased costs due to COVID but it appears that the substantial amount of federal and provincial aid has dampened that talk to the point where the proposed increase is now 2 percent for 2021.  However, many in City administration and on council feel that this is temporary, and we will be returning to business as usual with increases well over three percent in subsequent years. 


The response at some of the budget presentations last week was that even the proposed two percent now needs to be reduced further.  In response, the call by one councillor to accomplish that by simply taking the money out of City reserves or stabilization fund for this year again reflects the belief that the problems are short term and things will be better next year.  This is a mistake given the long-term structural problems affecting City of Thunder Bay finances.


[As an aside, the councilor’s quote that “That stabilization fund is there for crises, like the [2012] flood,” was interesting comment given that the 2012 flood affected several thousand homeowners much like the current leaky pipe pandemic and apparently dipping into the reserves then now seems to be viewed a form of assistance to homeowners. The City has remained tight-lipped on the leaky pipe matter since the start and now especially since it is before the courts as a result of a class action lawsuit.  However, the homeowners affected by the 2012 flood have also filed several large lawsuits so one wonders why the double standard in public commentary? Has some sort of self-imposed statute of limitations on discussions expired?]


Thunder Bay’s municipal finances are marked by a long term erosion of its property tax base due to industrial decline and a lack of population growth combined with above average spending and costs due to a higher cost structure acquired during a time when revenues were more abundant.  There is a failure to recognize or deal with the problem.  This higher cost structure is apparent when Thunder Bay is compared to major Ontario municipalities.


The following figures present municipal spending for Thunder Bay compared to 26 other major municipalities in Ontario for 2020 using data obtained from the BMA 2020 Municipal Report.  Note that for municipalities with regional government, in the police and fire categories, spending per capita for the regional functions was included on top of their reported municipal spending.  Figure 1 presents the per capita tax levy for all 27 cities as well as the average for them.  Thunder Bay does have the fourth highest tax levy [municipal operating spending] of these 27 major municipalities.  What is more interesting is when the composition of the spending is broken down a bit.


What emerges from Figure 2 to 6 is that Thunder Bay spends the most per capita on general government (administration), police and fire of these municipalities.  Thunder Bay spends $241 per capita on general government compared to the 27-city average of $113 – more than double.  It spends $317 per capita on fire protection compared to the average of $191 and $441 per capita on police protection compared to the average of $311. While in total, Thunder Bay only spends about 10 percent more per capita than the average, compared to the category averages it spends 116 percent more on general government, 66 percent more on fire and 42 percent more on police.


 When these three expenditure categories are summed up, it turns out that Thunder Bay spends nearly $1,000 per capita on general government, police and fire compared to an average of $612 – that is 63 percent more than the average.  While northern Ontario municipalities because of their larger urban areas and lower population densities have a tendency towards higher costs and spend more, we are head and shoulders above the rest of the North.  Looking at Figure 5, after Thunder Bay at nearly $1,000 comes Sault St. Marie at $752 and North Bay at $736. Sudbury is only at $656.


As a share of the per capita tax levy (Figure 6), spending on general government, police and fire in Thunder Bay at 56 percent is approaching nearly 60 percent!  The average across these cities is closer to 40 percent.  One cannot simply blame arbitration costs for police and fire spending in Thunder Bay because all cities in Ontario are under the same system and salaries do not differ that much across jurisdictions.  Based on what is being spent on administration, police and fire, we are spending an awful lot for government protection services which makes one wonder if in Thunder Bay we are living in some type of municipal public sector version of the Sopranos? The cost structure is a problem and require a concerted long term effort to bring costs and spending more in line with other jurisdictions. 

Saturday 20 January 2018

Crime in Northern Ontario Down


My last post on policing resources in the major northern Ontario cities noted that all five cities saw an increase in policing resources. In 2000, the largest number of police offers adjusted for population was in Thunder Bay at 171.6 (per 100,000 of population), followed by Sault Ste Marie at 156, Timmins at 153.1, North Bay at 147.6 and finally Greater Sudbury at 143.1.  By 2016, Thunder Bay was still first at 199.5 officers per 100,000 of population.  It was followed by Timmins at 196.2, Sault Ste. Marie at 176.7, Greater Sudbury at 160.7 and then North Bay at 152.6.  Growth in per capita policing resources was greatest in Timmins at 28 percent, followed by Thunder Bay which saw a 16 percent increase.  Next highest growth was Sault Ste. Marie at 13 percent, followed by Greater Sudbury and North Bay at 12 and 3 percent respectively.

Of course, the logical question that follows next is what was going on in crime rates over the same period of time?  It should be noted that policing is much more complex in the early 21st century dealing not only with traditional crimes but also with new crime areas such as cyber and internet crime.  As well, social issues in general have been consuming more police resources as well as new standards of accountability which entail more intensive use of policing resources when dealing with incidents.  Homicide investigation is especially resource intensive.  Nonetheless, a look at crime rates it is still a useful piece of information. 

Traditional measures of the crime rate such as criminal code incidents per 100,000 of population or per police officer measure the volume of crime.  One example is the homicide rate and past evidence has found the homicide rate declining in northern Ontario in a manner akin to other Canadian cities with the exception of a recent surge in Thunder Bay.  Another measure of crime is the Crime Severity Index.  The Crime Severity Index combines both volume as well as takes into consideration the seriousness of crimes by assigning each type of offense a seriousness weight and generally serves as a complement to other measures.  The index has been set to 100 for Canada in 2006 and enables comparisons of crime severity both at a point in time and over time. 

 
Figure 1 plots the value of the Crime Severity Index obtained from Statistics Canada for the five major northern Ontario cities for the period 1998 to 2016.  The severity of crime differs across these five cities in any given year but all cities have seen a decline over time.  The largest declines over time have been in Sudbury and North Bay at 36 and29 percent respectively.  Next is Thunder Bay with a 17 percent decline in crime severity between 1998 and 2016, followed by Sault Ste. Marie at 16 percent and then Timmins at 15 percent.  The good news is that while there are annual ebbs and flows, crime rates over the long term are down in these major northern Ontario cities.