Northern Economist 2.0

Monday 13 November 2023

Tracking Thunder Bay’s Economy: Another View


As 2022 begins to wind up, it is worth taking a look at how Thunder Bay’s economy is doing using less traditional indicators to shed light not only on its economic performance but the perennial question of whether its population is growing or not.  One way of looking at Thunder Bay’s economy and making some comparisons to other centers is the use of Tax Filer data available from Statistics Canada. The number of T1 Tax Filers can be used as a correlate of not only population numbers but also incomes and economic activity.   


Figure 1 plots the number of tax filers by year from 2000 to 2001 in the Thunder Bay CMA with a linear trend.  There has definitely been some growth in the number of tax filers over the last few decades. From 88,240 T1s filed in 2000 to 92,660 in 2021, Thunder Bay has seen a 5 percent increase in the total number of tax filers between those two years though numbers do fluctuate from year to year.  Thunder Bay’s CMA population in the 2001 Census was 121,986 and its CMA population in the 2021 Census was 123,258 – an increase of 1 percent.  One would expect the number of tax filers reporting income is somewhat a more robust count than the number of people filling out the census at least in terms of compliance. 


If the 5 percent growth Tax Filer growth rate was applied to Thunder Bay’s population in 2001, then in 2021 one would have a CMA population of 128,085.  So, in response to the question of whether or not there are more people living in Thunder Bay than the official census count states, the answer it is perhaps so.  Even so, it is not the tens of thousands of people that seems to have seized the imagination of local politicians lobbying for more resources.  At least that is assuming that these tens of thousands of additional people have employment and are reporting an income.  Of course, if they are not working and therefore not reporting an income or are working and not reporting an income, well those are entirely different matters that should definitely concern the federal and provincial governments.


Delving deeper into the numbers, Figure 2 plots the average annual growth rate of the number of T1 Tax filers over the period 2001 to 2021 for Thunder Bay, as well as Toronto, Hamilton, Greater Sudbury, and Ontario as a whole.  It appears that Thunder Bay’s average annual tax filer growth rate is well below that for Ontario and Toronto but also Hamilton and Greater Sudbury.   Thus, another indicator that while we are growing, we are not growing as quickly as other population centres. 


Finally, Figure 3 plots average annual T1 Tax Filer Income and it illustrates that while average income has grown, Thunder Bay is below Ontario and also below the other three comparison cities in the chart.  As of 2021, average tax filer income in Thunder Bay is $53,289 compared to $56,691 in Greater Sudbury, $57,936 in Hamilton and $59,410 in Toronto with the average for Ontario at $56,893. Given that average rents and cost of living in Thunder Bay have grown to levels not incomparable to southern Ontario cities, this would suggest that many in Thunder Bay are currently quite stretched when it comes to their finances.


So, there you have yet another set of performance indicators on Thunder Bay’s economy. 

Thursday 27 July 2023

Thunder Bay Crime, Policing and Population: An Update


Statistics Canada has released the police-reported crime statistics in Canada for 2022 and police-reported crime in Canada, as measured by the Crime Severity Index (CSI), increased for the second consecutive year, up 4% in 2022.  The CSI considers both the volume and the severity of crime. The police-reported national crime rate—a measure of the volume of crime—increased by 5% from 2021 to 2022, up to 5,668 incidents per 100,000 population. However, like the CSI, the crime rate in 2022 (-4%) was lower than in 2019.


Figures 1 and 2 provide the 2022 CSI and Crime Rate Per 100,000 population for Canada 35 CMAs and ranks them from highest to lowest.  Crime Severity was highest in Winnipeg, followed by Kelowna and Lethbridge while in terms of crime rates, Kelowna topped the ranking followed by Lethbridge and then Winnipeg.  In terms of crime severity, Thunder Bay ranked 7th highest of the 35 CMAs whereas in terms of crime incidents per 100,000, Thunder Bay dropped to 10th spot.  For those interested in a northern Ontario comparison, Thunder Bay's crime severity and crime rate exceeds  Greater Sudbury.


In the case of Thunder Bay, to provide some additional time series perspective, Figure 3 plots both crime severity and the number of police officers per 100,000 population from 2000 to 2022. Crime Severity has fluctuated somewhat over time though it has been on an upward trend since 2015 but remains below the peak year of 2009 when it reached nearly 115. Between 2015 and 2022, Crime Severity in Thunder Bay grew by 27 percent but if one looks at the period 2000 to 2022, then there has been a decline in crime severity of just over two percent.  


Another metric – not shown in any charts here – is the crime rate and the total number of crime incidents.  In 2000, the total number of total crime violations in Thunder Bay was 10,869 whereas by 2021 it had fallen to 8,117 – a decline of about 25 percent. Over the same period, the number of total crimes per 100,000 fell from 9084 to 6940 – a drop of 24 percent. If one takes the 2022 numbers in consideration, the rate appears to have declined further to 5842.


It is always interesting to compare the crime time series numbers to police resource numbers.  Policing numbers per 100,000 have trended upward throughout the period going from 173 officers per 100,000 population in 2000 and reaching 213 in 2022.  This represents an increase in per capita policing resources of 23 percent.  It should be noted that over the same period, the total number of civilian employees grew from 95 to 119 while the total number of officers grew from 207 to 249 – total increases of 25 and 20 percent respectively. 


Putting these increases into perspective, it helps to have some population numbers.  Over the same period, the population of Thunder Bay, Municipal as reported in these crime statistics by Statistics Canada fell from 119,657 to 116,968 – a decline of 2.2 percent. This is certainly a different number than one has seen in the past referring to either the CMA or the municipal population. While this is a larger number than the 2021 census city of Thunder Bay population figure of 108,843, it is also smaller than the CMA census population of 123,258.  One city, many population statistics.


So, that is a brief overview of the numbers. Make of them what you wish.  One imagines that personal and individual experience with crime never mind population growth in Thunder Bay may vary depending on your location or socioeconomic status.

Tuesday 18 July 2023

Population, Growth and Statistics in Thunder Bay


The City of Thunder Bay’s population according to the Census of Canada has remained essentially the same since the 1970s with some minor growth in the surrounding CMA.  This has occurred while elsewhere in the province and country, population soars.  Indeed, the city’s growth rate between July 2021 and July 2022 while positive at 0.2 percent, was actually the lowest in Canada for cities with populations above 100,000. 


With every census, there are the usual concerns with stagnation but despite the census evidence, there are actually two narratives when it comes to population in Thunder Bay.  One story is that given the city’s growth rate in population, there is a lack of economic growth and stagnation is a real concern given that population is attracted to economic opportunity.  When combined with the fact that the city and region appear to be aging faster than the rest of the province, the prospects for a more dynamic future look increasingly precarious.  However, the other story often voiced by local officals is that Thunder Bay’s population is much larger than the official population figures indicate.  In this narrative, Thunder Bay is an attractor for a transient regional population that comes in and makes use of its services. 


Even the current Mayor of Thunder Bay recently was quoted asserting that “he believes there are 15 per cent more people than recorded by Statistics Canada, adding that’s where a lot of the city’s financial problems come from, having to provide services for people that aren’t officially on the books, and hence aren’t counted when senior levels of government hand out transfer payments.” More directly, he said: ““We’ll ride with 120,000, but the police know, the hospitals know, the health-care system knows, and even the mercantile areas know it’s more than that. There’s more people around and if you spent one hour at city hall you’d know there are a lot more people wandering around the city than actually meet any census.” With an offical City population of 108,843 and a CMA/Metro population of 123,258, the mayor’s assertion suggests that Thunder Bay’s actual population range from City to CMA is from about 125,000 to 142,000.


Of course, such assertions would be useful if accompanied by time series data from police, paramedic, and hospital services though even that of itself is not sufficient.  After all, it is possible to have population growth flat, but usage rates rise.  With more use per capita, even with flat population growth, one could see paramedic or police services rise in total incidents.  Indeed, rising usage for hospital and paramedic services could be a function of a larger transient population or it could also be the result of an aging population.  However, without more detailed data, simply saying “if you spent one hour at city hall you’d know there are a lot more people wandering around the city than actually meet any census” is probably not going to cut it with the city’s governmental transfer partners. 


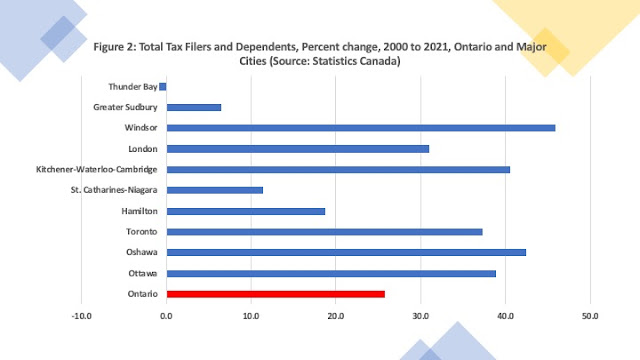
In the search for other approaches to the numbers, another way at looking at growth in a city is through federal tax filer data collected by the Canada Revenue Agency and disseminated through Statistics Canada.   The accompanying Figure 1 presents an index for the number of tax filers and their dependents for the period 2000 to 2021 for Ontario as a whole and a number of its major cities with the year 2000 set at a value of 100.  Over this period, the total number of tax filers in Ontario rose from 11,331,080 to 14,248,730 which when normalized with 2000 equal to 100 means Ontario went from 100 to 125.7 for an increase of 25.7 percent (See figure 2).  Over the same period, Thunder Bay went from 120,140 to 119,180 which when normalized goes from 100 to 99.2 for a decrease of -0.8 percent.  Indeed, of the cities on these two charts, Thunder Bay is the only one that sees a decrease in the number of total tax filers and dependents.


Does this mean that the mayor is wrong? Not necessarily. Given that the assertion is that these additional users of services are transient or temporary population, there is no reason that they would be registered with a residential address in Thunder Bay for income tax purposes.  All these figures do is confirm the official narrative from the Census and Statistics Canada that Thunder Bay’s population is essentially flat and has been for quite some time.  If there are indeed a large number of unofficial residents moving to and from the city using its services, then Thunder Bay needs to do a better job of presenting a credible statistical method of capturing that population.

Saturday 1 July 2023

Canada 100 Million: The Pros and Cons


Canada’s population has been growing dramatically over the last few years as a result of boosting immigration targets designed in part to address an aging population and labour shortages.  A larger Canadian population in the long run has benefits and costs and there has been debate over how quickly and by how much Canadian population should be growing.  For example, the non-profit group Century Initiative, wants to see Canada’s population reach 100 million by the year 2100 and sees benefits to a larger economy and market size as well as more clout when it comes to a global world.  A book by Doug Saunders called Maximum Canada sees a larger Canada as a way to avoid global obscurity. 


Of course, as all economic historians know, while more population can be a source of economic growth, there is a distinction between extensive and intensive growth.  That is, if population rises faster than output then per capita income will actually decline.  Then there are the adjustment costs of such a large population influx and Canada at the moment seems particularly hard pressed to increase its social and physical infrastructure – particularly housing and health – in the wake of large population increases.  The result has been a rising cost of living when it comes to housing costs.


Economists Mikal Skuterud, Chris Worswick and Matthew Doyle make the point in that increasing Canada’s population while increasing its economic size can also reduce the average person’s standard of living if economic output does not increase faster than population. Rising population without accompanying business investment to raise productivity is a recipe for a lower standard of living and Canada has had a productivity problem for some time now.


Moreover, while a larger population may be correlated with increased global clout, in Canada’s case it would also help in today’s turbulent world if the increased size came with a larger share of GDP spent on defense and a couple of aircraft carrier task forces with at least one with Arctic capability.  After all, the Philippines and Ethiopia both have just over 100 million people and they are not exactly throwing their weight around globally.  As in the case of housing and infrastructure investment, Canada has also lagged in its security investment and more people alone will not create the international respect some people think it will.


Since 2013, Canada’s population has grown by nearly 5 million people – a 14 percent increase - and is basically now at the 40-million-person mark.  Figure 1 presents the percent growth ranked by economic region – with some artistic license for the regional groupings – and shows that Alberta, British Columbia and Ontario have grown the fastest.  The Territories and Saskatchewan-Manitoba have been next, and the Atlantic Provinces and Quebec have grown the least.  


What this means is that over time, as Figures 2 and 3 illustrate for the period 1991 to 2023, the relative share of the Canadian population living in Alberta, BC and Ontario is growing while the rest is shrinking.  In the case of Quebec, in 1951 it had 29 percent of Canada’s population and by 1991 it was 25 percent and 2023 sees it down to 22 percent which has no doubt raised the hackles of Quebec’s premier.  If one accepts that a growing Canadian population will increase our economic mass and clout in the world, then one also needs to accept that Quebec, the Territories, the Atlantic Region and Saskatoba – will see diminished clout within Canada. 


And within provinces, it is likely that some regions will do better than others.  In the case of Ontario – the Greater Toronto-Hamilton Area is where most of the population will concentrate while it is likely given current trends that cities like Thunder Bay or Sudbury will not be that much bigger than at present by 2100.  True, climate change and other shocks make such forecasts subject to considerable uncertainty, but it would take some pretty incredible economic, political, and social forces to put Thunder Bay over one million people by 2100.


Needless to say, while a much larger population may assist in growing Canada’s economy and may increase our global weight, the outcome is not assured given our productivity lag.  This is really the crux of the issue.  It is not that Canada would not benefit from being larger and cannot accommodate more people, but it needs to be accompanied by the investment spending needed to expand our infrastructure.  Moreover, increasing our population will also require an effort to deal with the regional anxieties and tensions it will produce within Canada.  There is a role for government here in either helping facilitate and coordinate the necessary investments or get out of the way to let those that can get things done do their thing.  Still, we would not want a future without challenges and opportunities for our descendants.  Happy Canada Day.

Saturday 1 April 2023

The Thunder Bay That Never Was


For all sad words of tongue and pen.

The saddest are these, “It might have been.”

John Greenleaf Whittier


As a result of its historic evolution from the twin cities of Fort William and Port Arthur, Thunder Bay has always had two former downtown cores that have been the focus of constant attempts at revitalization as well as a third commercial retail core in the former intercity area.  Three downtowns for a city of 125,000 is a lot of downtowns and yet the process of revitalization continues unabated.  The latest iterations are the recent local media stories dealing first with the downtown north core which being adjacent to the waterfront has emerged as the “entertainment” and “tourist” district.  A planned reconstruction of the downtown street here to emphasize walkability at a total of $13.2 million is now considerably above the original estimates.  And on the other side of town, there is another major streetscape project that is even more involved as it requires the complicated dismantling of the Victoriaville Mall which was placed on top of the major downtown intersection at Victoria and Syndicate.  This too will require many millions of dollars – about $11 million in one estimate - and is likely to see cost increases before we are done. 


The evolution of both downtowns has marked a return to more open street and pedestrian spaces that were blocked by the erection in the 1970s and early 80s by downtown street enclosing and blocking malls – Keskus on the north side and Victoriaville on the south. Keskus was finally demolished in 1999 to make way for downtown development centered on the arrival of the OLG Thunder Bay Charity Casino.  The result has been a more vibrant downtown area of shops and restaurants.  There is a similar expectation of this happening in the south side after the removal of Victoriaville Mall.  In the end, both downtowns along with the intercity area have evolved to some extent in a manner remarkably similar to the paths outlined in several Chronicle Journal newspaper articles and opeds authored in the late 1980s and early 1990s (CJ “Assign each city core its own specializations, Weds. July 26, 1989; CJ City at a Crossroads Series, November 16, 17 & 24, 1990).  That is “core specialization” with the north side downtown a “tourism-commercial” area given the presence of the harbour and waterfront, the south side downtown an “administrative-commercial” area given the concentration of city government there and intercity area as “commercial-industrial”. 


With some exceptions this is somewhat what has happened.  The former Port Arthur Downtown has a waterfront park and the arrival of the new Art Gallery will be an important addition to a critical mass of activities and functions making it a tourism and entertainment core.  The former Fort William downtown has City of Thunder Bay offices making it the administrative core.  Meanwhile, intercity has become the choice for new retail development.  At the same time, there is a lot of inconsistency given that the community auditorium is in the intercity area rather than in a spectacular waterfront setting, there is still a substantial city office and utility presence in the Whelan building in the north core and the main arena complex – the Fort William Gardens – remains in Fort William.  And then, a plethora of public buildings – Mini Queen’s Park, a new federal building, and the public health unit as well as assorted offices – went outside the Fort William Core to off of Arthur Street, the Balmoral Area and intercity.  However, given the long-established urban pattern and historical rivalry between the two twin cities, such is the weight of history and adjustment, and change takes a long time in Thunder Bay.  And there is the reality that private developers will develop land they own to realize a return and not necessarily to implement an urban planning vision.


Still, change has occurred but all of this change and development pales somewhat with the anticipated urban renewal and development plans of the 1960s.  Urban renewal gripped Ontario municipalities in the 1960s and the former cities of Port Arthur and Fort William commissioned consultants coordinated by engineering firm Proctor and Redfern to put together comprehensive studies and recommendations on their downtown cores.  They were comprehensive plans for renewal of the aging cores that included general land use, streets and traffic analysis, parking, pedestrian circulation, and transit that assumed that both downtowns would retain their comparative size and strength and remain centers of activity.  The Port Arthur Report was delivered in February of 1968 and the Fort William Report in April of 1969.  


The before and after illustrations are quite dramatic.  Port Arthur has plans for a dramatic waterfront park and civic centre and plaza, plans for streetscaping and a new senior complex.  Fort William’s downtown plan was even more ambitious with apartment blocks along Vickers Street, a new civic complex and riverfront park adjacent to the current city hall. The removal of the tracks along the Kam River was shown with a new thoroughfare and a set of high-rise riverfront dwellings along a park and boardwalk.  As for shopping, a new retail mall on land off of May Street to be called the Kam Center was proposed. As the accompanying illustrations show, the downtowns especially in Fort William were to be higher density areas and pedestrian intensive.  In many respects, the downtown areas would be “15 minute” cities with many services within walking distance of where people lived.


Alas, the reports presented an urban downtown picture that did not come to pass for a variety of reasons.  First, they of course were made immediately obsolete by the Amalgamation that fused the two cities together and the resulting politics created new initiatives that included two downtown malls as part of core revitalization.  Second, the plans failed to anticipate and realize the rise of the intercity area which after Amalgamation meant it was poised to be readily developed as the choice location given it was between the two population clusters.  Third, the 1970s much like the rest of the country saw a suburban housing boom that led to car intensive sprawl rather than infill in the downtown cores.  And finally, there was a massive overestimate of where Thunder Bay’s population was going given that the proposals assumed rather robust population growth for the Lakehead area that by 1986 was forecast under various assumptions to range anywhere from about 150,000 to 175,000.  Indeed, under such assumptions, Thunder Bay today would be well over 200,000 but such growth was not supported by the future evolution of either the city’s economy or its demographics


At the same time, the Port Arthur waterfront park envisioned in 1968 has in many respects come to pass though without the massive civic plaza.  And the rehabilitation of Arthur Street (now Red River Road) has occurred as well as the senior’s complex on Cumberland.  As for Fort William, the results are more disappointing in that there is no William McGillivray Boulevard skirting the Kam River and a riverfront park and boardwalk, or density high-rise housing along the riverfront or a new Civic centre adjacent to the current City Hall.  As for retail, the street blocking Victoriaville emerged in the late 1970s but not the proposed Kam Centre.  The urban reality that evolved reflected the needs and wants of the times as well as the political environment.  Still, it is fun to look back and wonder what might have been under different circumstances.  There may even be some ideas in those old plans worth exploring further.

Sunday 27 November 2022

Northern Ontario: Demographic Indicator Overview


Last week, I gave an economic overview of the challenges and opportunities facing northern Ontario’s economy at the Regional Meetings of the Economic Developers Council of Ontario in Thunder Bay.  I covered a lot of ground, and it is worth presenting some of the highlights for the regional economy in terms of current indicators.  This post, a quick overview of some of the key demographic trends that have been emerging in northern Ontario over the last while.   


Figure 1 provides Census results from 2006 to 2021 and they show that despite the perceptions, northern Ontario’s population is starting to grow once again.  While the period 2006 to 2016 saw a slight decline, the 2021 Census shows that population is up in both the Northeast and Northwest of the region. Between 2016 and 2021, northern Ontario’s total population grew from 780,140 to 789,519 – an increase of 1.2 percent (See figure 2) with the Northeast growing much faster that the Northwest.  On the other hand, from 2011 to 2016, the Northwest grew substantially while the Northeast actually shrank.  


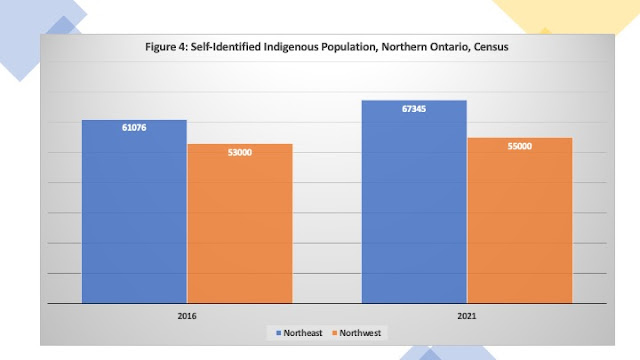
Two other trends worth noting.  First, while the conventional wisdom is that the major urban centres in Ontario’s north are all major attractors of population within the region, it turns out that between 2016 and 2021, Thunder Bay, Sudbury and North Bay grew while Timmins and Sault Ste. Marie shrank somewhat (See Figure 3).  Second, the population that self-identified as Indigenous in the Census has been growing.  According to the Census (See Figure 4) the Indigenous population in the Northeast rose from about 61,000 to 67,000 (about a 10 percent increase while that in the Northwest grew from about 53,000 to 55,000 – about a four percent increase.  If one adds up the two regions, in 2021 about 122,345 people in that year identified as Indigenous in the north or about 15 percent of northern Ontario’s population.  About 24 percent of the Northwest’s population self-identified as Indigenous while 12 percent of those in the Northeast did so.  However, it should be noted that these figures may be an under count of the Indigenous population.


The trends are positive in that the region’s population is growing but the point to consider is that it is growing slower than Ontario as a whole.  While Ontario’s population was up nearly 5 percent from 2016, the North is only up about 1 percent.  This means northern Ontario’s share of Ontario’s population (which peaked in the early 1950s at nearly 12 percent) will continue to decline, all other things given.  While 2021 saw the region’s share at 5.6 percent, according to Ontario government population projections, that share could decline to 4 percent by 2046.  It is relative rather than absolute decline in population that is the real concern given that a declining share is also associated with declining long-term representation and influence within the province and the country.

Wednesday 9 February 2022

Northern Ontario’s Population Growing But Performance Is Mixed


The 2021 Census detailed population results have been released and they show that Canada has been undergoing robust population growth that exceeds that of the other G7 countries.  According to Statistics Canada: “Approximately 1.8 million more people were calling Canada home in 2021 compared with five years earlier, with four in five of these having immigrated to Canada since 2016. Although the onset of the pandemic slowed population growth from a record high in 2019 (up 583,000 or +1.6%) to its lowest growth rate in a century in 2020 (up 160,000 or +0.4%), Canada's pace of population growth remains the highest in the G7.” Indeed, since 2016, Canada’s population has grown 5.2 percent while Ontario’s has grown by 5.8 percent.


The results for northern Ontario are intriguing given that the long-term propensity in the north has been towards a relatively flat population.  After the decline of the 1990s, population in the region stabilized but since 2016 the overall population has also grown albeit at a much lower rate than the rest of the province and the country.  Moreover, the growth performance is uneven with some parts of the north seeing increases and others declines.  Figure 1 shows the population by northern district as well as regional agglomeration. The north grew 1.2 percent since 2016 – well below the Ontario and Canadian population growth rates.


The northwest saw relatively restrained growth at just over one-fifth of one percent.  Within the northwest, Rainy River saw a decline of 3.4 percent while Thunder Bay district and Kenora district saw increases of six-tenths and seven-tenths of a percent respectively.  Most of the growth in the north’s population is coming from the northeast which grew 1.6 percent. Even there, there are some differences ranging from lows of -2.6 and -2.2 percent in Timiskaming and Cochrane while Parry Sound saw a 9.5 percent increase, Manitoulin 5.1 percent growth and Sudbury District (including Greater Sudbury) an increase of 2.9 percent.  While the north grew by 1.2 percent from 2016 to 2021, the Indigenous population on reserves grew 1.5 percent though even here there were interesting divergences are the approximately 115 Indigenous Reserve divisions.  For example, Bearskin Lake grew 26 percent while Pic River shrank by 16 percent. 


Like the rest of the country, the greatest population growth was in urban centers though even there the results are quite mixed (Figure 2).  Of the five major cities in northern Ontario, three saw population increases in their CMA populations – Thunder Bay (1.4 percent), Greater Sudbury (2.8 percent) and North Bay (1.9 percent).  On the other hand, Timmins and Sault Ste. Marie saw declines of 1.5 and 1.8 percent respectively.  When some of the smaller towns are examined, often there are declines.  White River for example, shrank by nearly 14 percent losing 88 people while Nipigon shrank 10 percent losing about 170 people. Even Kenora managed a slight decline though Elliot Lake grew at the national and provincial rates coming in at 5.9 percent.


These of course are just numbers, but the real question is why the differential growth across the region. Obviously larger centers do better because they offer a better set of amenities and economic opportunities but even being a larger urban center is not a panacea given Timmins and the Sault.  Given low rates of natural increase, some northern centers have done a better job at attracting new migrants and overall, the northeast has done better than the northwest given its proximity to southern Ontario.  Higher housing costs have seen Toronto’s population growth fall below that of adjacent cities like Hamilton, Barrie, and Kitchener-Waterloo. Some of the exodus has obviously spilled over into the near north regions of Parry sound and Nipissing as well as Sudbury. 

Thursday 13 January 2022

2021 Census Updates Out: Since 2016, Sudbury Up 2.2 Percent, Thunder Bay Up 0.3 Percent

A very quick post. So, the 2021 census population numbers are finally out from Statistics Canada along with updates for the entire 2001 to 2021 period. I have been waiting for these numbers for some time to see how Thunder Bay and Sudbury have done and the results are interesting.  Since 2016, Sudbury CMA has seen a population increase from 169,136 to 172,781 - an increase of 2.2 percent.  Indeed, Sudbury has seen a pretty steady increase in population since 2001 going from 164,210 in 2001 to 172,781 - an increase of 5.2 percent.  Thunder Bay CMA went from 126,696 in 2001 to 124,840 by 2016 before rebounding to 125,247 by 2021.  However, since 2001, Thunder Bay CMA  has actually declined by just over 1 percent.  Staring in 2016, there has been a tiny rebound equivalent to about one third of one percent.  Thunder Bay saw a major decline from 2004 to 2016 followed by a rebound that appears to have ended starting 2020. It would appear that the pandemic year has seen a bit of an exodus from Thunder Bay. So, from 2016 to 2021, Sudbury is up 2.2 percent and Thunder Bay 0.3 percent. So, there you have it.


Thursday 13 February 2020

Thunder Bay's Population Growing

Statistics Canada has just released its population estimates for sub-provincial areas as of July 1, 2019 and it appears that Thunder Bay's population -  while one of the slowest growing of Canada's CMAs - is nevertheless growing.  On July 1st 2019, Thunder Bay's Census Metropolitan Area reported 127,201 people which is an increase over the previous year of 0.7 percent.  Of the 36 major CMAs, Thunder Bay ranked 32nd and its growth rate was larger than the other major northern Ontario city on the list - Sudbury - which came in at 0.4 percent.  Population growth rates ranged from a high of 2.8 percent for Kitchener-Cambridge-Waterloo to a low of -0.1 percent for St. John's with the Canadian CMA average being 1.7 percent.  The accompanying chart presents the population growth rate rankings for all of the CMAs.  So, as far as things demographic go, this is pretty go news.  Thunder Bay is not shrinking.

Thursday 7 June 2018

The North and Ontario's Population

Well, today is election day and as we pause and wait for the results later today, why not take another look at northern Ontario's population but this time with numbers from the 2017 BMA Municipal Study.  Two items for your consideration. First, a table showing population in the major northern Ontario municipalities as well as the growth rates of their population for the period 2006 to 2011 and 2011 to 2016.  The table ranks the cities from the highest to lowest growth rates for the period 2011 to 2016 and they show that at the top are Parry Sound and Greater Sudbury.  Their populations have continued to expand and while their proximity to the GTA and its opportunities may be a factor it remains that proximity has not helped North Bay.  Also of interest is Elliot Lake which has taken to marketing itself as a retirement community.  Despite an aging population, people are not retiring to Elliot Lake in droves.


With the north not really growing while Ontario's population rises, its share of Ontario's population is also declining.  However, in this case it turns out that the North has plenty of company when it comes to shrinking population shares.  The figure below - also taken from the 2017 BMA Municipal Study (using data from the Ontario Finance Ministry) plots the population share of each of Ontario's regions since 1991 and projected to 2041.  It turns out that each region is expected to decline as a share of Ontario's population by 2041 with the exception of the GTA.  The GTA is projected to rise from 42% in 1991 to hit 53% by 2041.  As for northern Ontario - it is going from 8 percent of the population in 1991 to 4 percent by 2041.  At present it is about 7 percent.


Two things.  First, Ontario is becoming increasingly lopsided in terms of population and employment with the GTA enjoying a perpetual boom and the rest of the province with perhaps the exception of the Ottawa area undergoing a slow stagnation.   This will be a major challenge for the next government when it comes to dealing with the provincial economy.  Second, as many of you are aware, there was an increase in riding numbers for today's elections - there are now 124 seats in the legislature up for grabs.  Of those, 13 are in northern Ontario which means that 10 percent of the election ridings are in the north but only about 7 percent of the population.  Whatever northerners may think about their relative alienation and neglect by the south, it remains that their votes yield clout out of proportion to their population numbers.  Northern Ontario needs to make use of this influence while it still retains it. It is unlikely that 2041 will see the north with 10 percent of the seats in the legislature but only 4 percent of the population.

Monday 13 February 2017

Why the North's Cities are Losing Population

Everyone is still pretty much digesting last week's census results and the news that many northern Ontario's cities actually lost population.  Of course, the immediate gut reaction to the population decline of what are supposed to be the regional magnets for growth will focus on a slow economy as well as cries that the provincial government needs to do something.  I think its important to think more carefully about what actually is happening given that northern Ontario as a whole actually saw a slight population increase.  Here is my take on what some of the factors may be.

Wednesday 8 February 2017

2016 Census of Canada: Northern Ontario Results

Well, the population counts of the 2016 Census of Canada were released by Statistics Canada today and there is an odd assortment of results for northern Ontario that are both good and bad. Canada's population in 2016 was 35,151,728 - an increase of 5 percent from 2011 - while Ontario's population was 13,448,494 - an increase of 4.6% from 2011.  Northern Ontario's population actually grew between 2011 and 2016 from 775,178 to reach 780,140 for an increase of 0.64 percent. 

Wednesday 1 February 2017

Demographics in Northern Ontario: Getting Ready for Census 2016


On February 8th, Statistics Canada is expected to release the Population and Dwelling Counts for the 2016 Census.  This is of interest everywhere but no more so than in northern Ontario where the 2011 Census registered population declines from 2006.  Indeed, the long-term trend has been for a shrinking population in northern Ontario both in absolute numbers and as share of Ontario’s population.  In 1976, northern Ontario (Algoma, Cochrane, Kenora, Manitoulin, Muskoka, Nipissing, Parry Sound, Rainy River, Sudbury [District & Regional Municipality], Thunder Bay & Temiskaming) accounted for about 10 percent of Ontario’s population whereas by 2011 it was down to 6 percent.

Wednesday 8 February 2012

2011 Census Results for Population In: Northern Ontario Declines

Statistics Canada released the first set of 2011 census results today dealing with population and dwelling counts.  Canada's population is up 5.9 percent from 2006, Ontario's is up 5.7 percent while within Ontario, the North is down overall by 1.4 percent.  As the accompanying table shows, the Northeast stayed stable in terms of its overall population while the Northwest showed a decline of 4.7 percent.  As for the major urban centers of the North, Greater Sudbury posted a 1.6 percent increase, North Bay a 1 percent increase, and Timmins a 0.4 percent increase.  The Sault and Thunder Bay both saw declines in their populations of -0.4 and -1.1 respectively.

The Northwest during the period 2006 to 2011 worked its way through the aftermath of the forest sector crisis with the region outside of Thunder Bay bearing the brunt of the employment and population adjustment.  Employment and GDP in Thunder Bay shrank by about 10 percent during the forest sector crisis and its population has been remarkably resilient given the decline.  Employment in the region outside of Thunder Bay shrank by almost 30 percent.  Employment numbers over the last year have been showing increases in Thunder Bay and the Northwest and these population results are hopefully a lagging indicator.  The Northeast has been buoyed by its mining sector though there is a redistribution of population towards the major urban centers.  Evidence from the Northeast suggests that should the Ring of Fire mining development successfully proceed, the Northwest can also expect to see stabilization and even some growth in its population.

What will be interesting is the additional sub-regional breakdowns in population with the Northeast and the Northwest.  For example, between 2001 and 2006, while the Northwest declined in population, the Kenora District actually saw increasing population.  As well, the aboriginal population increased substantially in the Northwest between 2001 and 2006.  Further results and analysis on whether these trends have continued since 2006 to come.