Northern Economist 2.0

Monday 25 March 2024

Ontario government’s fiscal history drenched in red ink

 This post originally appeared on the Fraser Institute Blog, March 25th, 2024.

Ontario government’s fiscal history drenched in red ink

Ontario government’s fiscal history drenched in red ink

The Ford government will table its next budget on Tuesday. But a longer-term perspective on the evolution of Ontario’s government finances provides some important context for today. Since Confederation, Ontario has seen a massive expansion of its revenues, expenditures and debt. And its fiscal performance in terms of balancing its finances has oscillated over the years. Using data from the Finances of the Nation database, assorted Ontario budgets, and the Fiscal Reference Tables, a picture of change and variable fiscal responsibility emerges.

With revenues of $2.3 million and expenditures of $1.2 million in 1868, Ontario had a substantial surplus and no debt. Indeed, substantial surpluses marked much of the pre-Second World War era. By 2023, the Ontario government had spending of $199 billion and revenues of $193 billion for a deficit of nearly $6 billion and a net debt of $400 billion. Ontario government spending on a real per-capita basis was relatively modest from 1867 to 1913 (despite province-building activities such as roads and railroads) and was financed primarily by federal government grants and natural resource revenues from forestry and mining. The period after 1914 saw an expansion of both government spending and revenues that was quite dramatic compared to the prior period, but which paled in comparison with the post-1957 expansion into health, education and social services.

With respect to revenue composition, Ontario gradually shifted from a reliance on natural resource rents and government grants to own-source revenues from income, consumption and other assorted taxes. When compared to the federal government—the only other Canadian government larger than Ontario in terms of total revenues or expenditure—in real per-capita terms Ontario spent less than the federal government until the early 1990s surpassing the Ottawa in 1993 for the first time. By 2020, real per-capita Ontario government spending was actually more than federal real per-capita spending, though the pandemic years saw a reversal.

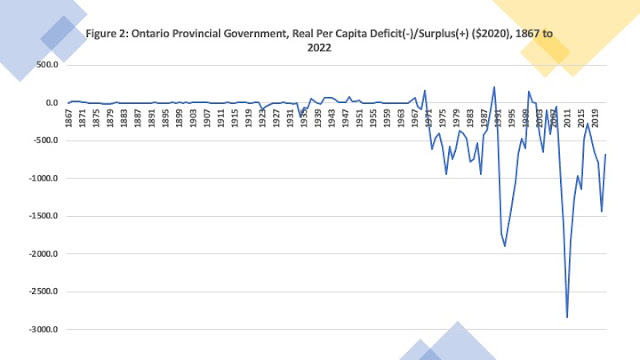
What’s truly remarkable about Ontario’s finances is its growing reliance on deficit financing since the 1970s. Over the entire 1867 to 2023 period, Ontario ran an operating deficit in 70 out of 157 years or approximately 45 per cent of the time. However, in the first 100 years from Confederation (1867 to 1967) Ontario only ran 22 deficits—that’s 22 per cent of the time. In the fiscal years from 1968 to 2023, Ontario ran 48 deficits in 55 years—or deficits 87 per cent of the time. Deficits have gone from being a temporary departure for exceptional times to a near permanent device.

The accompanying charts plot Ontario’s deficits, its deficit-to-GDP ratio, its net debt and its net debt-to-GDP ratio from 1960 to the present. The first chart illustrates that Ontario maintained its largely balanced budget approach to its finances for most of the 1960s but incurred deficits in the 1970s.

Figure 1

Its three largest deficits were in 2010 ($19.3 billion), 2011 ($17.3 billion) and 2021 ($16.4 billion). As a share of GDP, the second chart illustrates that Ontario’s three largest deficits were in 1992 (3.7 per cent), 1993 (4.1 per cent) and 1994 (3.5 per cent). Ontario’s pandemic deficit peak in 2021 came in at 1.7 per cent placing it lower than some of the deficits of the 1970s and early 1980s.

Figure 2

Deficits plus interest eventually result in accumulated debt and Ontario like other provinces has added to that by borrowing for capital spending on top of its operating deficit. As the final chart shows, in 1960 Ontario had a net debt of $994 million and net debt-to-GDP ratio of 6 per cent. Today, net debt tops $400 billion and the net debt-to-GDP ratio is about 36 per cent. The profiles for net debt and net debt-to-GDP suggest Ontario’s net debt has grown in three phases.

Figure 3

The accumulation of net debt takes off in the mid 1970s, then accelerates in the 1990s and accelerates yet again after 2008. These periods of acceleration have all coincided with periods of economic slowdown or recession in the province—the low growth stagflation era of the 1970s, the recession of the early 1990s and recession/financial crisis era of 2007 to 2009. In each of these periods of distress, deficits mounted, yet even when the economy and revenues began to recover, spending growth and deficits continued. In essence, the Ontario government ran deficits during bad times and better times, giving a fiscal dimension to the provincial motto “Loyal She Remains.”

As Ontario moves forward from the pandemic era, it remains to be seen if the government will rein in perpetual deficit financing and halt debt accumulation, or if the government will embark on yet another cycle of mounting debt. In many respects, the government has continued to spend at a rate well above its economic ability and performance. Key to the issue is Ontario’s productivity lag, which has resulted in slow growth relative to the rest of the country. If the Ford government continues to spend as if Ontario was still experiencing the high growth rates of an earlier era, that’s not a sound recipe for fiscal responsibility.


Wednesday 22 November 2023

What the Federal Economic Statement Did Not Highlight


Well, the Federal Fall Economic Statement for 2023 is out and soon to be relegated to the collections of fiscal and economic history.  There is a lot out there summarizing the economic and fiscal situation facing the federal government. Briefly, for 2023-24 it looks like revenues of $456 billion and expenditures of $489 billion for a deficit before actuarial losses of $32.5 billion and a deficit with actuarial losses of $40 billion.  Inflation this year will be about 3.8 percent and next year the outlook is for 2.5 percent while real GDP growth in 2023 is now forecast to end up at a lower 1.1 percent and for next year at a paltry 0.4 percent.  On the bright side, there are measures to create more housing, but they add up to perhaps 300,000 homes by 2031 which given the country apparently needs 3.5 million means the housing shortage is going to be around for some time to come. 


Two things the numbers on the fall statement do not highlight.  First, when one factors in population growth going forward at about 2.5 percent annually and the government's inflation and GDP growth forecasts, real per capita GDP is going to continue declining over the next five years.  As Figure 1 shows, by 2028, inflation adjusted output per person by 2028 will be lower than it was in 2014.  Given the anemic business investment in Canada and the resulting weak productivity performance of the Canadian economy and its inability to grow faster than population, falling real GDP per person means a declining standard of living.  We are looking at essentially a lost decade or more if nothing happens to ramp up growth.


Second, a fiscal anchor or guardrail set as a deficit to GDP ratio of 1 percent means that there will be perpetual deficits for years to come of at least 30 billion dollars.  Put more starkly as Figure 2 illustrates, federal revenues and expenditures will continue to grow in tandem like ships traveling alongside in the night but never actually meeting.  This will result by 2028 in a net federal debt of almost $1.5 trillion and debt service costs of about $60 billion annually which as a share of federal revenue will account for about 10 percent of revenue.


Needless to say, it is not surprising that these types of projections are not front and centre from the perspective of a government facing slowing growth and rising spending.

Friday 3 November 2023

Ontario’s 2023 Fall Economic and Fiscal Statement: Some Thoughts


Finance Minister Bethlenfalvy released Ontario’s fall 2023 fiscal and economic update and a perusal of the numbers tells a number of stories.  First, the province is expecting the economy to slow down with consequent effects on its revenues though the current outlook for the current fiscal year 2023-24 shows tax revenues up just over 3 percent while 2024-25 and 2025-26 are currently projected at growth of 3.3 and 6.1 percent respectively.  Indeed, the period from 2022-23 to 2024-26 is expecting to see total revenues up 14 percent.  Over the same period total program spending is expected to rise  by 8.5 percent, debt interest by 22.6 percent and total expenditure will be up by 9.4 percent. 


Thus, revenues are projected to grow faster than expenditures but the gap between revenues and expenditures will persist until 2025-26 when a small surplus of 500 million dollars is forecast.  However, given spending that year includes a reserve of $2 billion set aside, it is likely the surplus that year will be much bigger. An economic slowdown notwithstanding, the province appears to want to keep a deficit on the books for as long as possible no doubt in part as a cautionary measure given economic uncertainty but also to quell demands for more public spending.  And as for economic uncertainty, employment is expected to grow each year until 2026 and the unemployment rate at its highest will reach 6.6 percent before declining to 5.8 percent by 2026. Hardly the recessions and downturns of yesteryear.


However, two items did catch my eye.  First, for 2023-24, the net public debt is expected to take a bit of a leap to $416 billion.  From 2018-19 to 2023-24, the net debt will have grown from $338 billion to $416 billion, an increase of 78 billion dollars or 23 percent.  However, deficits over that same period only sum to $42 billion.  In other words, an amount over and above the sum of accumulated deficits of $36 billion has been added to the net debt.  While this is of course likely the result of current government accounting practices that book capital and infrastructure expenditures separately from the operating expenditures, it is nevertheless a sizeable increase to see. 


More seriously, is the following.  If one takes past, current, and projected nominal GDP for Ontario, factors in inflation using the CPI as well as assumes population growth going forward at the medium Finance Ministry scenario of 250,000 people a year (about 1.7 percent), one gets a picture of real per capita GDP in Ontario that suggests that by 2025, real per capita GDP will be no higher than it was in 2017.  If one looks at the accompanying figure, despite ebbs and flows (with a particularly large ones circa the pandemic) as well as the early 1990s) real per capita GDP growth has been noticeably slower since about 2000.  The average annual growth rate in real per capita GDP from 1960 to 1999 averaged 2.1 percent while from 2000 to what is projected by 2025 the growth rate is 0.5 percent. 


You can blame some of this on population growing more quickly over the last few years, but the real culprit is that productivity growth in Ontario is lack lustre.  The long-term effects of productivity decline have begun to manifest themselves in our standard of living.  Real per capita GDP in 2022 in $2020 is $64,170.  If since 2000, real per capita GDP had grown at the average annual rate from 1960 to 1999, in 2022 it would be about $86,000 – that is a difference in output of nearly $22,000 per Ontarian.  It is not apparent that this stark difference has sunk in yet across political and policy circles in Ontario.  We have foregone a lot of output given our productivity decline and in the absence of a shift, that amount will only continue to grow.


Friday 23 June 2023

The Finances of the University: A Lakehead Update


My last update on Lakehead University’s finances was in October 2021 and at that time despite the pandemic, it was doing well according to its 2020-2021 financial statement. From 2020 to 2021, revenues did fall slightly from $200.2 million to $198.4 million – a drop of just under one percent.  However, total expenses fell even faster going from $198.7 million in 2020 to $187.6 million in 2021 – a drop of 5.5 percent.  As a result, there was an operating surplus of $10.691 million in 2021 which was up from a surplus of $1.542 million in 2020.  And this was before the unrealized gains from an interest rate swap are factored in which brought  the total surplus to $14.456 million.  In the end, the sky did not fall during the pandemic. Moreover, there has been a long period of good financial performance given that over the 2000 to 2022 period, there have only been six deficits with the remaining years seeing surpluses – that is about 75 percent of the time.


We are now in summer of 2023 and while financial statements for 2021-22 are up and available, those for 2022-23 have yet to appear.  However, this type of lag appears customary across Ontario universities as the 2022-23 statements do not seem to appear on other university sites yet either.   Nevertheless, it is possible to quickly update the figures provided in October of 2021 with an additional year of data. 


Figure 1 shows that for 2022, revenues were at $184.824 million, down by $13.6 million dollars while expenses were up $17,470 million reaching $205.227 million.  As a result, the previous year’s surplus of $10.691 million had become a deficit of $20.403 million. If one factors in unrealized gains on interest rate swaps, then the deficit falls to $16.729 million.  At first glance, it would appear that the end of COVID savings and the resumption of in person teaching was accompanied by both rising expenditures and falling revenues. 


However, while general government grants from 2021 to 2022 fell from 64.014 million to $61.611 million, restricted grants rose from $16.838 to $22.005 million.  As well, Student fees also rose from $84.460 million to $86.962 million while the sales of goods and services nearly doubled in value going from $6.621 million to $12.279 million. All in all, taken together, these should result in rising rather than falling revenues.  However, the crucial variable here is the inclusion of investment income which was $20.055 million in 2021 (hence the large surplus that year) and -$5.384 million in 2022 (hence part of the 2022 deficit explanation).  However, it should be noted that much of this deficit is due to investment performance and if the 2021 investment performance had replicated itself, one would have seen a balanced budget if not a small surplus.


Figure 2 plots the university’s long-term debt, and it declined slightly in 2022 going from $106.575 million in 2021 to $103.655 million.  Figure 3 plots the main revenue sources – general government grants and student fees - in longer-term detail.  Total student fee revenue has been approximately stable since 2019 ranging from $84.460 million to $86.962 million.  This is despite the fact that tuition fees for domestic students were cut 10 percent by the provincial government and then frozen during that same period.  Like many other universities, Lakehead is now more reliant on international students whose tuition is not subject to the same restrictions. 


General government operating grants in absolute terms have also been stable for quite some time but in real terms (after inflation) they have declined.  As a share of total revenues, student fees have steadily increased over time while government general grant revenue has declined as a share of revenue.  Student fees now account for nearly 50 percent of Lakehead’s total revenue with general government grant funding now at about one-third.  This makes Lakehead much more sensitive to enrollment fluctuations than it would have been two decades ago when students fees accounted for about 30 percent of its total revenues.


Fortunately, enrollment has held up (See figure 4).  Total headcount enrollment (number of full time and part time students) has grown nearly 30 percent since 2017.  In 2022  the total headcount (as of November 2022) grew nearly 1 percent.  While the university’s total headcount has seen ebbs and flows, the overall trend since 2000 has been upwards.

So, there you have the update. Looking forward to the 2022-23 Financial Statement release!

Thursday 13 April 2023

Revisiting the Federal Finances


In the wake of the Federal 2023 spring budget, it is useful to take a look at the historical picture to see how the present and the immediate projected future fits into the long-term pattern of federal spending.  The key defining issue of recent public finance and government spending was of course the pandemic and the enormous amount of federal fiscal stimulus that was injected into Canada’s economy.  Federal spending rose from $363 billion in fiscal 2019-20 to reach $639 billion in 2020-21 – an increase of 73 percent.  It then declined reaching $480 billion as reported in Budget 2023 but is set to resume an upward trend and is expected to reach $556 billion by 2027-28.  As of the 2022-23 fiscal year, federal spending is 37 percent higher than going into the pandemic meaning an average annual increase in spending of about 12 percent.  This has been funded by deficits which in turn have increased the federal net debt dramatically going from $813 billion in 2019-20 to $1.3 trillion by 2022-23 and expected to reach just over $1.4 trillion by 2027-28.


A key feature of the pandemic is what appears to be a dramatic reversal of the decline in federal program spending as a share of Canada’s GDP – the so-called “federal fiscal footprint”.  Figure 1 uses data I compiled for my 2017 federal fiscal history with updates from the federal Fiscal Reference Tables and Budget 2023 to look at the program expenditure to GDP ratio for Canada from 1867 to 2022 and then projected forward to 2028. Fitting a simple linear trend shows that over time, there has been an expansion of federal program expenditures relative to GDP rising from about 5 percent in the 1870s to about 15 percent by the 1980s and with the COVID expenditure bump approaching 17 percent. 


Of course, there have been ebbs and flows around this linear trend with notable spikes during WWI and WWII.  It is noteworthy that the COVID spending spike represents the second highest federal program expenditure to GDP share with World War II as the highest.  After the spike and drop of the war era, the post WWII period saw a gradual rise in the federal fiscal footprint that saw it rise from about 10 percent in 1948 to peak at nearly 19 percent in 1982 and then decline, reaching 11 percent by 2000.  Since 2000, it has risen with a spike in 2021 at the height of the pandemic that brought the program expenditure share of GDP to 23 percent.  It has since declined to about 15 percent.  However, going into the pandemic it was just under 14 percent, up 1 percentage point since 2014 and the forecast of 15 percent means the federal footprint has returned to the size it had in the late 1970s to mid 1980s. 


Of course, we all know what happened after that.  There was a rise in the federal debt as a result of accumulated deficits and high interest rates that at first squeezed out program spending – note the decline into the 1990s even before the federal fiscal crisis – and then of course the transfer cuts and program expenditure reductions of the federal fiscal crisis. This of course makes the role of debt charges and interest rates of particular interest and Figure 2 plots two series: federal government debt charges as a share of total federal government expenditures and the effective interest rate on the federal net debt (defined as debt charges divided by net debt).  


The period from 1870 to WWI saw a decline in interest rates and not surprisingly a decline in the debt charge share of federal spending.  What surprises most people is that as a result of all the provincial debt the federal government took on at the dawn of Confederation, about 30 cents of every federal dollar of expenditure was going to service the debt in 1867.  Spending on nation building infrastructure such as railways saw debt levels and debt charges accumulate in the 1870s and 1880s but then came the great boom of prairie settlement after 1896 .  World War I saw an accumulation of debt and a rise in interest rates and with the budgetary and economic shocks of the Great Depression, debt charges as a share of total federal spending remained at over 25 percent.  Indeed, there is probably an interesting economic history thesis in explaining why there was a federal fiscal crisis in the 1990s but not the 1920s. 


The post WWII era saw a rise in interest rates that surpassed even the rise of the pre-WWI era and as significant budget deficits and debt began to accumulate after the mid-1970s, debt charges as a share of total spending began to rise.  However, with the positive budgetary balances of the post fiscal crisis era as well as the decline in interest rates, both interest rates and federal debt charges as a share of total spending hit historic lows.  In 2021, federal debt charges as a share of total federal spending was just below 5 percent and the effect interest rate on the net debt was about 1.8 percent.  Those numbers will be ones for the economic history books in the years to come as the debt service share of federal spending approaches 10 percent and the effective interest rate is just under 4 percent.  At least, that is what is currently forecast.

Tuesday 21 March 2023

Ontario Budgets: The Long View


As we get ready for Ontario Budget Day, its always fun to look at the long-term picture to see where Ontario has been.  And by long-term, I mean the entire period in which Ontario has been a province of Canada – 1867 to 2022.  Figure 1 uses data from historic Ontario Budgets for the and from the Finances of the Nation fiscal and macroeconomic database to construct and plot real per capita Ontario government revenues and expenditures in 2020 dollars for the period 1867 to 2022.  Real per capita revenues have grown from about $40 per person in the 1870s to reach over 10,000 dollars today.  Expenditures have followed a similar pattern.  Much of the growth in per capita spending has occurred since the mid 1960s with the expansion of public health care as well as education spending.  From 1868 to 1965, real per capita expenditures grew from $22 to $1468 and since then has grown to reach $11,470.  Indeed, the implied annual growth rate of real per capita spending over this entire period works out to about 4 percent.


Figure 2 weighs in with a long-term picture of fiscal balance – deficits and surpluses.  Needless-to-say, a better measure would be a deficit to GDP ratio but Ontario GDP pre-1960 is more difficult to acquire though one day constructing estimates going back to 1867 is possible.  Over the entire 155-year period covered by this data, there has been a deficit in 87 years – 56 percent of the time.  Deficits were less common prior to 1945 with deficits only 46 percent of the time whereas since 1946 there has been a deficit two-thirds of the time.  However, the post-World War II period can be divided into two periods – one of consistent surpluses and one of consistent deficits.  The longest consecutive run of surpluses in Ontario history is from 1941 to 1967. In the period since 1967, Ontario has run a deficit 93 percent of the time. 


And there you have it. Happy Budget Day.

Friday 17 March 2023

Ontario's Spring Budget Approaches


Ontario will be announcing its 2023-24 budget on March 23rd in the wake of its third quarter fiscal update in February which reported a $6.5 billion deficit for 2022-23, an improvement over the Fall Update which had the deficit pegged at nearly $12 billion.  It would appear that fiscal circumstances are shifting rapidly as the Ontario economy appears to continue to exhibit robust growth resulting in revenues rising more than expected.  Indeed, revenues in 2022-23 are projected to be $16.6 billion higher than forecast in the 2022 budget and $9.6 billion higher than was projected in the Fall 2022 update.  Meanwhile, expenditure growth appears to be somewhat more restrained.  Compared to what was projected in the 2022 budget, 2022-23 is only up $3.3 billion. Even in the case of health spending – a contentious area given shortages and waiting lists – the province’s financial Accountability Office has noted that going forward, the province appears to be allocating billions of dollars less than what is required.


Indeed, a glance at some charts shows that these shifting projections go back even further to the 2021 budget that came as the pandemic recovery began in earnest.  Figures 1 and 2 plot revenues and expenditures as laid out by fiscal documents starting with the 2021 budget, the 2022 budget and the fall 2022 economic and fiscal update.  Both expenditures and revenues have shifted upwards with subsequent budgets and updates, but the shifts are more dramatic for revenues than expenditures.  Compared to revenues in 2019-20 of $156 billion, for 2022-23, the 2021 budget forecast $160 billion, the 2022 budget forecast $180 billion and the Fall 2022 update forecast nearly 187 billion to which the third Quarter update has now brought us to $196 billion.  Despite the pandemic and fears of deflation and revenue collapse, revenues today are $40 billion higher than 2019-20 – an increase of 26 percent.    


As for expenditures, from $165 billion in 2019-20, for 2022-23, the 2021 budget forecast $186 billion, the 2022 budget forecast nearly $199 billion and the Fall 2022 update a few hundred million more but still rounding out to $199 billion.  We are now looking at expenditures based on the third quarter update of nearly $202 billion.  Since 2019-20, expenditures have grown by $37 billion – an increase of just over 22 percent.  


What comes next over the course of fiscal year 2023-24 hinges on how the economy performs.  If we assume inflation coming down to 4 percent and real GDP growth of 2 percent, that still brings us to nominal GDP growth of 6 percent.  While 6 percent nominal growth is down from the nominal growth rates in 2022 and 2023, there is no reason to believe it will crash given the overall robustness of the Canadian and Ontario economies despite increases in interest rates. Historically, a one percent increase in the province’s nominal GDP is correlated with a greater than one percent increase in total revenue meaning that one can probably expect total provincial government revenues to rise by over 6 percent this year bringing revenues up easily another $15 billion.  With a deficit for 2023-23 now being projected as per the third quarter finances at $6.5 billion, it would not be a surprise if it comes in even lower and 2023-24 actually presents us with a hefty surplus.

Saturday 4 March 2023

Blue Ribbons and Ontario Universities


Ontario has made a number of announcements regarding its post-secondary education sector.  First, it extended its tuition freeze for a third year.  As you might recall, going into the pandemic, Ontario reduced domestic student tuition fees by ten percent and since then has held them frozen meaning that after three years of time and inflation, in real terms tuition has been reduced by at least twenty percent.  Though not emphasized this week, Ontario’s government grants to its universities also remain largely frozen.  As a result, with flat domestic enrollment and frozen funding, at the margin, Ontario university revenues have only been growing because they have been recruiting international students making them increasingly reliant on what could be a volatile source of revenue.


However, the provincial government is concerned enough about the future sustainability of its universities that it has also announced a Blue Ribbon Panel to “provide advice and recommendations to the Minister of Colleges and Universities to help keep the post-secondary education sector financially strong and focused on providing the best student experience possible. ” A blue ribbon panel or committee is generally a group of “exceptional” and “accomplished” people who are brought together to study a particularly vexing problem and bring their expertise to bear on providing solutions.  It is several notches below a Royal Commission but designed to bring a semblance of non-partisan expert advice to a problem.  This panel is expected to report back in summer of 2023.


Now it has already been remarked that there are no faculty representatives on this Blue Ribbon Panel.  However, it would be churlish to say the least to infer that the provincial government in any way thinks that university or college faculty are neither exceptional or accomplished.  In trying to choose faculty representatives for such a committee, one opens a can of worms larger than the universe.  If the provincial government had selected someone from the humanities, professional schools and sciences would have complained they were being neglected.  If a scientist, the humanities would have been outraged. If they chose a faculty member from a large university, the small universities would have complained.  If they had picked an economist, there would have been a chorus of criticism charging that the outcome was predetermined by selecting a minion of the capitalist neoconservative hegemony. You get the picture.


So in the end, the government chose a panel from people that it sees as leaders without a direct current stake in universities to study the problem.  There are no faculty nor do  there appear to be any currently serving university administrators on the panel either, though they all have links to post-secondary education in one form or another as well as board and community experience.   There is a member with student experience.  And there is past faculty and administrative experience in the case of Bonnie Patterson and Alan Harrison – who incidentally is also an economist who was at McMaster teaching at the time I was there in the 1980s.  There does seem to be an emphasis on CEO types with some financial experience and also strong representation from the new age of e-learning and other types of perceived innovative practices in education with CEOs from E-Campus Ontario and Contact North.


So, what will the panel decide? Well, that is to be decided obviously though I suspect e-learning and micro-credentials is one direction they are likely to emphasize. That will not please some universities who are trying to bring everyone back to the before times with full in person learning and on campus presences including night classes.  However, this is motivated as much for pedagogical reasons as it is for financial ones rooted in the need to fill parking lots, residences, and cafeterias with paying customers.  


The crux of the problem is that the provincial government thinks universities should be training people and providing marketable skills and is not happy where the money seems to be going.  Parents and students think that universities are supposed to provide the ticket to a career and lifestyle and do not seem to think the tuition fees worth what they are getting – though they still insist their kids go to university.  Essentially, the provincial government and the public do not perceive they are getting value for money especially given what appear to outsiders to be high paying cushy jobs for university faculty and staff. 


Meanwhile, university faculty believe they are independent researchers and scholars, building minds, and extending the frontiers of knowledge while university administrators seem to be conflicted players of whack-a-mole - negotiating the competing demands of government, parents and students, donors, and faculty and staff.  As the old university adage about where the money should go goes, faculty like new faculty hires, Deans like new programs, while University Presidents like new buildings.  So, the interim solution by government has been a grant and tuition freeze which universities have got around by bringing in more international students who can be charged as much as the market will bear.


Needless to say, this is not a scenario for long-term sustainability.  Demographics suggest that domestic enrollment in Ontario has peaked and will remain flat for some time to come.  Thus, without an increase in tuition fees, domestic students will not lead to increased revenues.  Moreover, domestic students want a flexibility in their learning environments – i.e., online learning – that seems to be at odds with the preferences of many university administrators and faculty.  Bringing in more international students is also not a stable long-term solution given that at any time that tap could shut.  And then there is the question that if the Ontario public university system is something Ontario does not want to pay more for either via public funds or private (more tuition) and is increasingly geared to international students, then why should it be as large as it is?


This last question is the uncomfortable one but needs to be asked given the increasing financial stress Ontario universities are facing especially in the shadow of the Laurentian bankruptcy.  Does Ontario have too many public universities given domestic demand? That is a question the Blue Ribbon Panel will inevitably have to answer.  Perhaps there should be mergers and rationalizations culminating in several province wide campuses – A University of Southwestern Ontario, A University of Eastern Ontario, a University of Northern Ontario and then a half dozen or so fully comprehensive research universities?  Should some universities be merged with community colleges to create Polytechnics?  Should there be a provincial E-University to satisfy the demand for flexible credentials earned online?  But then what of the rest of the system?


In the wake of the Laurentian debacle, the provincial government has nevertheless been creating new small financially weaker universities left right and center so it appears they are not too concerned that there may be too many universities.  Moreover, all communities with their own current university campuses will scream if their university is no longer a “real” university or does not offer the range of programs they are used to having.  Just don’t ask them to pay for it.  The political cost of major change is high and as a result there is unlikely to be any major change. 


My guess, is that along with keeping all the current players in Ontario’s university system, the end game is going to be the creation of assorted new online learning options independent of the current system and perhaps even new targeted private micro-universities that will provide the programs the provincial governments thinks should be offered.  This is in keeping with the provincial government policy towards its post-secondary sector of the last thirty years that has allowed colleges to evolve into perceived lower cost universities and universities expand their physical footprints without much thought as to what might happen down the road. 


Some of this is already underway and what the Blue Ribbon Panel may offer is some way of moving forward in a transitioning post-pandemic university environment that is still moving towards an unknown equilibrium.  At minimum, it will provide a justification for what the government wants to do. On the other hand, the panel may surprise everyone – including the government - with their recommendations which is why governments do not necessarily follow what Blue Ribbon Panels or Royal Commissions for that matter, suggest they do.


Saturday 5 November 2022

Federal Finances and Fiscal Projections


The Federal Fall 2022 Economic and Fiscal Update is now economic history and for 2022-23 it projects budgetary revenues of $446 billion, program expenditures of $438 billion, public debt charges of $35 billion, a deficit (including net actuarial losses) of $36 billion and a net federal debt of  $1.283 trillion.  By 2027-28, revenues are expected to rise to $542 billion with total expenses including actuarial losses of $537 billion meaning that a budget surplus is anticipated within five years. 


While total spending in 2022-23 is actually down from 2021-22 as a result of the COVID-19 unwind, it remains that compared to spending in 2018-19 of $346 billion just prior to the pandemic, "reduced" federal spending in 2022-23 is expected to be one third higher and projected to rise to $487 billion in 2023-24.  In other words, over a five-year period, the federal fiscal footprint after the COVID-19 unwind expanded at an average annual growth rate of 8 percent.


Despite the economic uncertainty currently present with respect to inflation, interest rates and the potential of a recession, the federal forecast is remarkably upbeat with both its  ‘downside’ and ‘upside’ forecasts for growth, unemployment, and the federal finances remarkably close to one another.  This of course means that the deficit forecasts that range from $36 to nearly $50 billion are also in a sense somewhat optimistic and hinge on economic conditions and in particular the impact of any downturn on federal revenues.  When it comes to forecasting the fiscal future, the greatest source of uncertainty is apparently not on the expenditure side – which is more in the hands of the federal government – but the revenue side which is in the hands of the economy.


A case in point is illustrated in figure 1 which presents federal estimates for revenue and expenditure for the 2021-22 fiscal year starting with the spring budget pf 2021.  What is remarkable moving forward to the final numbers for 2021-22 as released in the public accounts and also presented in the Fall 2022 update is the remarkable stability of the expenditure estimates and the constant revisions on the revenue side.  Compared to the initial budget forecast in 2021, expenditures went down slightly from $497.6 billion to $493.3 billion by fall 2022 – less than 1 percent variance.  On the other hand, revenues appear to have been significantly underestimated as the economy did better than expected and inflation helped pump up federal revenues from an original estimate of $355 billion to $413 billion – a 16 percent variance.  As a result, the deficit estimate also fell from $143 billion to eventually $90 billion.  This was not the result of fiscal restraint – expenditures stayed pretty much stable.  It was purely from the revenue surge.


Why does this matter?  What goes up can also come down.  Expenditures over the next five years are projected to rise steadily recession or not and one suspects based on past performance that barring a sudden policy shift those estimates will be close to the mark.  Meanwhile, while revenue growth is a function of the economy.  The economy rebounded better than expected and as a result revenues did too. However, while revenue was underestimated over the last couple of years, it could easily be overestimated going forward which means the optimistic deficit reduction scenario with a surplus by 2027 is as uncertain as economic forecasting in general.   


Despite the public pronouncements that there is now more frugality at the federal level, that is not the case.  The federal government is projecting average annual revenue growth from 2023 to 2027 at an average of 4.7 percent while expenditures (after the drop in 2022-23) will rise at 2.6 percent.  The federal government is banking on the revenue surge of the last couple years to continue and keep revenues growing faster than spending.  A severe recession could upset that optimistic projection.

Wednesday 8 June 2022

Rising Surpluses, The Other Shoe Drops...and Manure


Well, the City of Thunder Bay’s finances just keep getting better. After projecting a positive variance of $3 million for the 2021 budget year, and then a surplus for 2021 that was supposed to be coming in at $5.6 million, the 2021 surplus has now come in at $10.9 million.  Thunder Bay will have its seventh consecutive positive budget variance making for accumulated variances of $31.3 million over seven years.  Indeed, this is the largest surplus in seven years.  While much of the savings will come from lower-than-expected COVID costs for which the city has received substantial  federal and provincial support, it remains that the City of Thunder Bay could obviously use some some help in crafting their budget projection and forecast models. 


Figure 1 plots the annual tax levy increase since 2015 against the corresponding surplus at year end.  For example, in 2015, the tax levy increase was $9.4 million – a 5.7 percent increase on a $164.7 million levy the year previous. The year’s end saw a positive variance of about $1 million which on $174 million tax levy was just over one-half of one percent.  Since 2015, however the size of the surplus has increased substantially, often coming close to matching the size of the tax levy increase that year.  In 2017 for example, the levy increase was $5.96 million – a 3.3 percent increase – but the year-end surplus came in at $5.6 million – almost 95 percent of the value of the original levy. For 2021, there is now a surplus of $10.9 million – which is more than double the original tax levy increase of $4.3 million.  This is indeed a first, a surplus bigger than the  year's tax levy increase.  I suppose if they had some creative economists working for them, the City of Thunder Bay could spin this as a tax levy surplus multiplier of 2.53.


If Thunder Bay had been able to correctly forecast the surplus each year and implement a tax increase incorporating the surplus and balancing the budget, what could have the alternate tax levy increase have been? Figure 2 plots the actual percentage tax levy increase since 2015 and the alternate increases.  In 2017, for example, the budget could have been balanced with an increase of 0.2 percent but instead there was an increase of 3.3 percent.  The year 2020 saw an increase of 2.7 percent but all that was needed is an increase of 0.6 percent.  Meanwhile, the surplus for 2022 means that rather than a 2.1 percent levy increase, there could have been a levy reduction of 3.3 percent


Outrageous?  Not so much as the other shoe that has dropped in the face of growing surpluses - a hefty pay increase for some City Managers.   Some managers this year will see raises as high as 12 percent with the range for 319 management and non-union staff ranging from 4 to 12 percent this year.  Given the stress of managing city services during a pandemic, one can certainly understand the need for raises.  At the same time, there have been a lot of stressed-out public-sector employees in health and education and guess what?  The provincial government held them at one percent a year for the last three years.  What should we think of all this during a municipal election year?  Well, here is another great juxtaposition – the City of Thunder Bay is offering free compost to residents while quantities last with a half-ton load limit per person.  With a $10.9 million dollar surplus, one would think the supply of compost would be endless.  They really have stepped into it this time.

Saturday 9 October 2021

The Finances of the University-Lakehead Edition


Many will have caught Alex Usher’s post on HESA dealing with university finances in Canada during the pandemic year which paints a surprisingly different picture of university finances than what one might expect.  Of the 34 universities with data available for the 2020-21 fiscal year, 30 of them posted surpluses and some of them were quite staggering.  For example, a 726 million-dollar surplus at University of Toronto (a $441 million surplus the year previous) or Queen’s with $144 million surplus (year previous was $35.7 million).  This seems quite at odds with the sky is falling scenarios that propagated the early part of the pandemic as universities argued that they were going to lose money. So how did this happen?


According to Usher: “Well, apart from the University of Saskatchewan (where the turnaround was mostly due to a quite amazing uptick in the investment portfolio), the formula was pretty simple.  Overall, university revenues rose slightly – about 2.6% in nominal terms – while expenditures stayed unchanged.   Essentially, the savings from keeping campuses closed offset the usual 2-3% growth in salary costs.”  Indeed, as he concludes: “universities did not in fact lose money during the pandemic.  They cut their budgets in anticipation of a fall in revenue and then the fall never came.  They will be in good shape to deal with the next year or two when, I suspect, we will see a bit more labour militancy that we’ve seen for awhile.”


So of course, the interesting question is how did Lakehead University do?  Well, Lakehead has also done surprisingly well according to its 2020-2021 financial statement that was recently released. From 2020 to 2021, revenues did fall slightly from $200.2 million to $198.3 million – a drop of just under one percent.  However, total expenses fell even faster going from $198.7 million in 2020 to $187.6 million in 2021 – a drop of 5.5 percent.  As a result, there was an operating surplus of $10.691 million in 2021 which was up from a surplus of $$1.542 million in 2020.  And this was before the unrealized gains from an interest rate swap are factored in which brings the total surplus to $14.456 million.  It turns out Lakehead, like Saskatchewan, did very well on its investment portfolio seeing an increase in investment income from $3.4 million the year before to $20.055 million – a staggering 488 percent.  One wonders why their management of their own investment portfolio does not translate into better management of the university pension plan – one of the worst university pensions in the country in terms of the benefits provided to retirees but I digress.


On the revenue side, aside from investment returns it turns out everything else was down.  Government general grant revenue was down 3 percent while student fees were down 1.5 percent.  There was a slight fall in enrollment which accounts for this as total enrollment (full-time and part-time students) went from 8505 to 8365 – a decline of 1.6 percent.  However, the good news is that 2021-22 is expected to see a rebound with total enrollment currently estimated at about 8668 – an increase of about 3.6 percent.  So, one can expect both tuition and grant revenue to rebound this year. 


As for expenses, well salaries and benefits were down -0.3 percent, supplies for operations were -25 percent, the costs of operating assorted sales and services were -61 percent, building and equipment maintenance costs were -19 percent and travel was down a remarkable 93 percent – from $4.1 million the year before to $302 thousand during the pandemic year.  This may prove to be one of the more important cost savings as the constant shuttling of administrators and staff from Thunder Bay to Orillia and Toronto obviously can be replaced by Zoom technology.  As for salaries and benefits, the university took full advantage of the provincial restraint salary guidelines thereby keeping compensation cost growth low and that will continue this year given the contract that was negotiated.  And, it turns out that having all the faculty and staff work from home saved several million dollars in operations and maintenance as costs like utilities were shifted onto employee home budgets.


So, in the end the sky did not fall and when the last year is placed in long-term context, Lakehead’s finances are indeed looking quite robust.  Figure 1 plots revenues, expenditures, and deficits since 2000 and they show growing revenues and expenditures and deficits in only 5 of the last 21 years. The last five years have seen a string of operating surpluses of which 2020-21 is the largest. Indeed, Lakehead has seen an accumulated surplus since 2020 of $83 million dollars.  Where has that money gone? Likely into the university’s long-term investment portfolio which according to the financial statement sits at about $144 million dollars and of course this year earned a whopping $20 million dollar return.  It certainly has not gone into paying down the debt which as Figure 2 shows went up $8.038 million in 2020-21 from th year previous to reach $106.6 billion.  This was to finance the athletic facility expansion. 


When it comes to long-term major revenue performance as depicted in Figure 3, government grants in total dollars have been flat at about $65 million annually since 2010 and as a share of total revenue have declined from a peak of 43 percent in 2009 to reach 32 percent at present.  As for student fees (tuition), it has grown dramatically since 2010 –nearly doubling from about $43 million in 2010 to reach $84 million at present.  Figure 4 shows that enrollment growth is only partially responsible for this because despite the long-term upward trend, total enrollment is about where it was a decade ago and has been recovering after a decline.  What has changed is the composition of the students as there has been a larger share of international; students who also pay much higher tuition.


So, there you have it.  Lakehead’s finances during the pandemic were quite good and come on top of a long-term stable and improving financial situation marked by rising revenues, enrollment growth and an expanding university investment portfolio.  This echoes the comments made by the university during the situation at Laurentian that Lakehead is "very financially sound".  That is good to know. If Alex Usher is right, Lakehead like the rest of the university sector will see increasing calls from its faculty and staff for a return on their investment of time and personal resources into the operations and success of the university.

Monday 26 April 2021

Thunder Bay City Finances Reporting Another Surplus


The City of Thunder Bay is now projecting a positive variance of $3 million for the 2021 budget year.  Despite the ongoing COVID-19 pandemic and its costs, the City of Thunder Bay is receiving more financial support than expected from both federal and provincial levels of government.  As well, policing costs as well as other expenses such as debt interest are coming in lower than expected.  If the assumptions underlying this budget update forecast come to pass, then for 2021, Thunder Bay will have its seventh consecutive positive budget variance making for accumulated variances of $17.1 million over seven years. 


Needless to say, this “good news” will be used to lend a positive vibe to discussions of spending more money on big capital projects such as a revised Multi-use Indoor Turf Facility project or the new proposed police facility.  After all, with City finances in such “good shape”, we can afford to spend more. Until next fall of course when the discussion will tilt to how we need to raise taxes 3-4 percent. It would appear that the budget spin in Thunder Bay changes from quarter to quarter depending on the need to support the needs and aspirations of the moment.


Positive variances are an odd term.  The term variance makes it sound like all that has happened is that the numbers they are getting now are somehow at “variance” with the original budget.  The degree of economic literacy in the general public and maybe amongst a few of the city councilors is such that they probably do not realize that a “positive variance” on the budget is not some type of COVID-19 hybrid spreading to the finances but rather than what it really is: a surplus.  What the city is really saying is that they either have or are projecting an operating surplus on the tax supported budget.  At three million dollars it is just about the size of the tax increase they brought in this year meaning that once again taxes came in much higher than if spending estimates were on the nose.


Of course, this is a COVID-19 year and a lot of unexpected things can happen.  Moreover, while having very large positive variances means that the tax rate levy that was imposed was again higher than it needed to be in 2021, one does not want municipalities to become spendthrifts and needlessly run down their reserves.  After all, it was not that long ago that negative variances were more of a concern as the accompanying figure illustrates.  As the numbers for the City of Thunder Bay show, negative variances used to be a problem but to its credit the city actually got a handle on its spending to the point where the financial leaks have been plugged.  Too bad, they could not solve the City’s ongoing leaky water pipe crisis too.


Municipal governments of course are not allowed to run deficits on operating expenditures by the provincial government, so deficits are covered out of reserve funds while surpluses can be used to augment reserve funds.  At the same time, many municipalities – Thunder Bay included – are now in the practice of running habitual surpluses funded out of tax increases that are often higher than they need to be. Enjoy the surplus. We are paying for it as ultimately it comes from taxpayers at either the local, provincial or federal level.