When it comes to employment growth, the Canadian and Ontario economies are still growing relatively robustly despite nearly a year of Bank rate increases that aim to cool off the economy and inflation. The accompanying figure presents the percent change in total employment (monthly data, three-month moving average, not seasonally adjusted) across Ontario and its main economic regions over two recent time periods: May 2022 to May 2023 (over one year) and January 2023 to May 2023 (the last five months). The results suggest overall robust growth but with some major differences across the province.
Year over year (May 2022 to May 2023), employment in Ontario as a whole has grown nearly 2 percent with the period from January 2023 to May 2023 growing at just below 1.5 percent. Year over year growth was highest in Windsor-Sarnia (9 percent) followed by the Kitchener-Waterloo-Barrie area (7 percent), Muskoka-Kawartha (5 percent) and then the Northwest (4 percent). Toronto and Ottawa also saw growth year over year at about 2 percent respectively. The latter two account for most of the job creation in Ontario despite the lower growth rate because well over half of Ontario employment is in these two cities.
What does stand out in these employment growth numbers is that some parts of Ontario are not doing as well as others. Kingston-Pembroke, Hamilton-Niagara, London and Northeastern Ontario have seen employment decline both year-over-year and since January of this year. While Windsor is up significantly year-over-year, it turns out that 2023 has seen much slower growth. Stratford-Bruce is down year-over-year but there has been growth in 2023. Then there is Northwestern Ontario which appears to be in the midst of a relatively strong employment surge.
So, overall Ontario is still booming. Over the period 2006 to 2023, average annual monthly employment growth has been approximately 1.2 percent so growth rates in the 1.5 to 2 percent range mean Ontario as a whole is still doing exceptionally well. True, these growth rates are down from the immediate rebound of the post pandemic era but overall since May of 2022 Ontario has added 144,000 jobs which averages to about 12,000 jobs a month - well above historical performance. On average, since 2006 Ontario has added about 7500 jobs a month. As for the regions exhibiting slowdowns in employment creation, they are in many respects areas where longer-term economic and employment growth has consistently been a challenge with the exception of the Northwest which seems to be seeing a robust uptick rooted in forestry, mining and tourism as well as public sector construction.
So, with the first half of 2023 nearly done, it appears Ontario overall is in good shape.
The Conference Board of Canada has issued its March 2023
Metropolitan outlooks for Thunder Bay and Greater Sudbury and the immediate
news looks good for Thunder Bay.As a
result of the construction of a new provincial jail in Thunder Bay over the new
two years, Thunder Bay is expected to see its real GDP grow 3.6 percent in 2023
making it number 1 out of 24 comparable CMAs for economic growth.On the other hand, Sudbury at only 1.4
percent projected growth for 2023 is still doing well and expected to rank 12th out
of the same 24 CMAs.Sudbury is doing
well as a result of expected persistence of demand for nickel given the growth
of the electric car industry. In terms of how Thunder Bay and Sudbury will fare
in the longer term based on these economic drivers, the Conference Board
projects that Sudbury will see some continued growth particularly in employment but Thunder Bay after the
construction boom is expected to falter somewhat given the absence of a more
robust long-term driver.
Figures 1 and 2 plot both real GDP growth and employment growth
for Thunder Bay, Sudbury and Ontario as presented by the Conference Board
reports.While 2023 sees Thunder Bay
surpass both Ontario and Sudbury for growth, for the 2024 to 2027 period, Sudbury
sees real GDP growth stay at about 1.5 percent while Thunder Bay falls to just
over one-half of one percent.Despite
the anticipated slowdown in 2023, Ontario real GDP growth recovers to an
average of over 2 percent for 2024-27. In terms of employment growth, Thunder
Bay sees a surge to a 4 percent growth in jobs created for 2024 but eventually sees
employment shrink moving into 2025 to 2027.While Sudbury also is expected to see lower employment growth moving
forward, it remains positive to 2027.
And finally, Figure 3 provides a retrospective on local
investment spending for the two cities in terms of the value of building
permits from 2014 to 2021.Fluctuations
notwithstanding, the long-term trend up to 2021 has been slightly positive for
Sudbury, and slightly negative for Thunder Bay. Going forward, housing starts
are an important component of building permits, and the provincial and federal
budgets are expected to see some initiatives for boosting housing spending.The Conference Board is forecasting that
total housing starts in Thunder Bay will fall from 193 units in 2021 to 161 in
2023 but then start to increase reaching 237 by 2027.Sudbury is expected to follow a similar
pattern declining from 434 starts in 2021 to 269 by 2023 but then recovering to
301 by 2027.
Both communities have aging populations which in the absence
of economic opportunities attracting large scale immigration means that investment,
employment, and real GDP growth in the long term will lag the rest of the
province. One potential game changer is of course in the area of mining for
both communities given the global demand for critical minerals and the expected
development of the Ring of Fire. Tomorrow’s
provincial budget may provide a glimpse of what might happen there in terms of infrastructure spending.
It is municipal budget season in Ontario and many municipal ratepayers across the province are waking up to projections of fairly large tax increases as a result of inflationary pressure. It is interesting that when municipal finance officers talk about inflation they invariably mention the effects of the war in Ukraine. I must admit, I would be interested in an explanation by a municipal CAO as to how the war in Ukraine has directly impacted a municipal budget in Thunder Bay or Sudbury. Nevertheless, we should move on to the main event here.
When it comes to Ontario’s municipal sector, getting a
handle on the numbers can be a challenging and complicated endeavor. Indeed, it
has already been noted by at least one think tank that municipal budgets in
Canada are
not user friendly and are quite difficult for the average citizen to
understand.In the case of Ontario
municipal budgetary information, there are standardized reporting templates or Financial
Information Returns that are available through the Ministry of Municipal
Affairs and there is annual data for each municipality but the assorted excel
spreadsheets with multiple sheets and windows are not terribly user
friendly.
And then there is the case of trying to get a handle on
employment numbers – again not a very transparent process.There is your core municipal employment in
terms of administration and staff which can then be augmented by protection
services such as fire, employment and paramedics and then there are some
municipalities with other services such as long-term care.Thunder Bay is a classic example of the
difficulties in getting estimates as they are presented as Full Time
Equivalents or FTEs with police reported separately and the time series not
terribly extensive even when you
can track them down.And of course,
given the idiosyncrasies of each municipality, forget about inter municipal
comparisons.
In the end, trying to get data on municipal employment in
any Ontario municipality is exceedingly difficult and so one is often forced to
improvise.One avenue worth pursuing is not going
directly to municipalities but the provincial government which as a result of
its public sector disclosure act collects data on Ontario public sector
employees making more than $100,000.This allows one to at least get a consistent comparative handle on
municipal employees across Ontario municipalities albeit only those earning over $100,000.
Figure 1 presents the number of municipal employees earning
$100,000 or more for the five major northern Ontario cities – Thunder Bay,
Timmins, Greater Sudbury, Sault Ste. Marie and North Bay – for the period 2017
to 2021.The number of employees making
over $100,000 – let’s call them Listers – grew in all five of these cities over
time with a particularly noticeable bump in 2020.For example, in Thunder Bay, there were 417
municipal Listers in 2017 and this rose to 452 by 2019 and then jumped to 558
in 2020 before declining slightly to 547 in 2021.A similar pattern was observed for Greater
Sudbury and to a lesser extent in the other three cities.
Interestingly enough, in 2021, Thunder Bay had the most
municipal Listers at 547 followed by Sudbury at 540, then the Sault at 246, North
Bay at 187 and finally Timmins at 142.This ranking roughly parallels population size with the exception that
based on population, one would expect Sudbury to exceed Thunder Bay.Sudbury’s population is about 60 percent more
than Thunder Bay but in 2021 Thunder Bay had practically the same number of
employees making over $100,000. Indeed, one can make an additional number of
comparisons from the data – the total wage and salary bill in 2021 for Listers,
in each municipality, the average salary per Lister and the per capita cost of
Listers in each municipality (constructed by dividing the total wage and salary
bill for those making more than $100,00 by the municipality’s population). These
are presented in Figures 2 to 4.
Figure 2 ranks the total wage and salary bill for municipal
listers and shows the total in 2021 was largest for Thunder Bay at $69.6
million (down slightly from $70.9 million in 2020 but up substantially from
2019 at $54.7 million) and the smallest for Timmins at $17.4 million.Given the difference sin municipal population
size, the totals needs to be supplement with adjustments for employment size or
population.
Figure 3 ranks the
municipalities by the average salary per municipal lister and they range from
$135,557 for North Bay (Thunder Bay is second at $127,171) to a low of $122,188
for Timmins.Figure 4 is the most
interesting however as it takes the total wage and salary bill for Listers in
each municipality and divides by the population of the municipality to present
a per capita cost.The per capita cost
of Listers was highest in Thunder Bay at $628 per capita and lowest in Greater
Sudbury at $403 per capita.
The Thunder Bay numbers are worth drilling down into further
given that adjusted for population, they definitely standout from the other
municipalities.That will be a future
post.
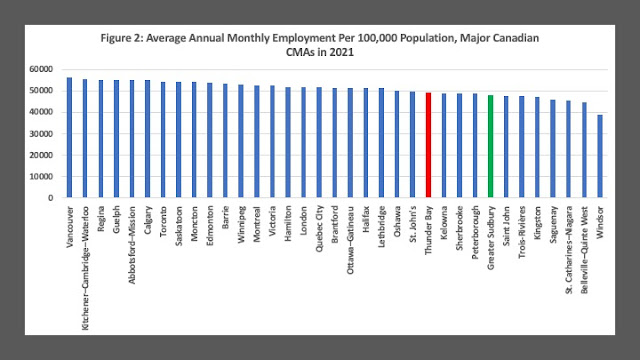
Labor markets are at the forefront in terms of current policy issues given the shortages that are plaguing so many sectors in Canada's economy. During the pandemic year, employment in Canada took a major hit but had largely recovered by the end of 2021. When we look at employment and jobs in Canada using data from Statistics Canada, our usual approach to where the jobs are is something akin to what we see in Figure 1 below. Canada has 35 major Census Metropolitan Areas (CMAs) each of which is a regional labor market on its own with employment opportunities that need to be filled and employment that is created. Canada's largest nodes of employment are Toronto, Montreal and Vancouver with average monthly employment in 2021 at 3.4, 2.4 and 1.5 million jobs respectively. The numbers fall quite dramatically after that and by 11th place London you below 300,000 jobs. Twelve cities have fewer than 100,000 people employed ranging from Guelph at an average of 91,000 to Belleville which is just below 50,000. Incidentally, Thunder Bay has the second smallest total number of jobs of these 35 Canadian CMAs.
Of course, larger population centers generally are going to have more total employment. Another way to look at employment is in terms of employment intensity or density. In per capita terms, do some cities simply have more employment depth or density adjusted for population meaning ultimately more jobs and opportunity? This is done in Figure 2 where the same cities are now ranked in terms of employment per 100,000 population. The falloff from the top to bottom performers is no longer as dramatic when the comparison is done this way. Vancouver is now the most employment dense CMA with 56,507 people employment per 100,000 population while Windsor is the least employment dense at 39,122. Thunder Bay moves up significantly from the previous ranking now placing 24th out of 35. Meanwhile, Toronto is not as employment dense as Regina or Guelph but tops Saskatoon and Moncton.
A historical point: Thunder Bay's CMA population has not changed much in 40 years but its total employment prior to the forest sector crisis of the early 2000s used to fluctuate between 65,000 and 70,000 jobs whereas now it fluctuates around 60,000. That means that several decades ago, Thunder Bay was more employment dense than the present. Naturally, a historical examination of employment density is in order for many Canadian CMAs but one suspects it would provide answers that many would rather not hear.
Still, if you are looking for employment nationally, it is not just the total size of the labour market in terms of jobs that you should be looking at but also the density of employment. On the one hand, places with low employment density may be facing more of a labour shortage and therefore be a source of opportunity. More likely, places with higher employment to population ratios are simply more dynamic economically and have more opportunities to offer. Places with low employment to population ratios may simply be more economically depressed that those with higher ones.
If the June
2022 Labour Force Survey is part of a trend, Canada’s labour shortage
issues are going to be getting worse.On
the positive side, the unemployment rate reached a new consecutive low of 4.9
percent in June and politicians with vested interests will no doubt seize on
this as good news.On the other hand,
total employment fell in June by 43,000 jobs with the employment loss almost
entirely due to a decrease in workers aged 55 years and older.As well, the number of self-employed workers
fell by 59,000 (2.2 percent) while the number of employees in both the public
and private sectors held steady.Dig
deeper, and the long-term trend shows self-employment declining while public
sector employment has grown over the last few years – not exactly good news for
the health of the business sector.And,
as final points, the size of the labour force between May and June shrank by
97,500 while the participation rate in the economy shrank from 65.3 percent to
64.9 percent.Remember that this is the
start of summer, usually when things pick up.
So, what is going on here? I like to term this the Thunder
Bayization of Canada’s economy.For
quite a few years now, Thunder Bay and indeed much of northern Ontario has seen
low unemployment rates.These are
usually touted by local community leaders as good economic news.After all, if the unemployment rate is low
what could be better news than that?Except, the problem is that in the case of Thunder Bay, both the labour
force and total employment shrank permanently after the forest sector crisis
nearly twenty years ago and has never really recovered.Moreover, with the aging of its labour force,
the local labour force has shrunk faster than employment hence resulting in a
decline in unemployment rates.Total
employment has shrunk.This continues as
even the June 2022 labour force shows that in Thunder Bay since May the labour
force and total employment both fell though this time employment fell a bit
more than the labour force so that the unemployment rate rose slightly to 4.3
percent.Think about it – a chronically
depressed city-region with an unemployment rate below the national average of
4.9 percent.
There is a lot going on here but basically, the two-year
pandemic hiatus of less work with substantial government benefits, the
continuation of extended EI benefits and accumulated savings have caused a
shrinking of people ready and willing to work.Combine that with an aging labour force – about 20 percent of the labour
force and employment is people aged 55 and over – and the start of retirements
which has probably also been accentuated by the pandemic.Indeed, one suspects that for some the CERB
was a nice early retirement/buyout package courtesy of the government.Then there is the pandemic toll on small
business and the resulting shrinking of self-employment also.Put it all together, and you have the start
of a growing and continuing labour shortage in Canada.
Thunder Bay can function in an economy where the number of
people shrink, and inflows of assorted government transfers keep the economy
going.However, can this be a
sustainable future for an entire country where more and more people simply
withdraw or retire from the labour force and the number of people available for
work and employed shrinks?Can an
economy where everyone wants to enjoy the consumption of goods and services exist
alongside one where there are not enough people available to work?In the absence of immigration, this would
probably be worse.Food for thought.
Ontario’s economy over the last decade has seen the GTA-Waterloo-Barrie
triangle as the province's employment growth engine with the Ottawa region thrown
in for good measure.The rest of the
province has seen more differential and often slower employment growth.While many in northern Ontario might feel that all of southern Ontario
is a cornucopia of economic growth it remains that even this region is not homogeneous.One interesting region a stone’s throw from
the GTA is of course the Niagara region which can be subdivided into the
Hamilton area at the head of the lake and St. Catharines-Niagara along the remainder
of the Niagara peninsula.
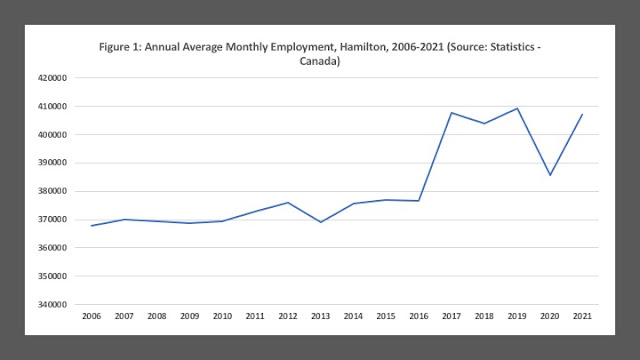
Figures 1 and 2 show employment in these two sub regions of
Niagara for the period 2006 to 2021.After
almost a decade of stability, Hamilton saw an employment boom after 2016 which
saw about 30,000 jobs – an 8 percent increase – added literally overnight.While there was a drop during the pandemic,
the rebound has returned employment to almost where it was during the boom
suggesting that this is a permanent expansion in its employment base.Between 2006 and 2019, St. Catharines-Niagara
added about 12,000 jobs – an expansion of 6 percent over a much longer
term.However, the pandemic rebound does
not seem to have taken hold in the region and employment now is back where it
was over a decade ago.
This differential performance between two sub-regions adjacent
to the GTA is largely a function of Hamilton’s closer proximity to Toronto
which is fueling a construction boom in residential development both detached
and multi-unit.The downtown area is
seeing numerous high density condominium units and even the rest of the city
particularly on the mountain fringe demarked by beyond Rymal Road is seeing
residential development.Of course the
continued expansion of residential sub-divisions is causing concern as adjacent
farmland is being taken out of service and urban sprawl proceeds.This of course raises an interesting dilemma
as on the one hand, housing has become extremely unaffordable in Hamilton over
the last couple of years in part because of supply constraints in the face of
increasing demand.
However, it is not just all residential construction.There have been quite a few non-residential
projects over the last few years including a new Amazon distribution center
currently underway near the airport area, and expanding transport, retail and research facilities.
The result is employment growth as Hamilton becomes increasingly integrated
into the Mississauga Conurbation stretching from Oshawa-Whitby in the east to
Hamilton with feelers stretching down to St. Catharines.The launch of hourly GO-Train service into
Hamilton this month is the final linchpin that will make the city a home to
more Toronto based employees.However,
without an expansion in housing supply whether high density infill or new
greenfield, housing prices will likely continue to rise. This risks pricing local residents out of their own city - something that is already happening.
With each passing day, the new COVID-19 case count has been
diminishing in Ontario.Today’s tally
was 114 and there were zero deaths.Indeed, the number of daily deaths has been in the single digits since
July 1st.For Thunder Bay District,
the last while has seen a zero daily case count more often than notThere are only two active cases in the
District and the hospital has no COVID cases.And vaccination
rates continue to grow with 69 percent of all people in Ontario having
received at least one dose and 47 percent being fully vaccinated with two
doses.For the time being, the pandemic
is practically over, and the province is slowly reopening its economy with the third stage
set to begin this Friday.
Moving forward, the challenge is many-fold.First, the damage done to the economy is
significant.Ontario had the most protracted lock down in Canada and indeed in much of the developed world. There are many businesses
that after such a protracted lock down will not reopen.The implications for business formation and
investment is serious.Moreover, the
reopening is proceeding at such a slow pace that it may indeed be too late for
many businesses.Employment is
rebounding but we are still not where we were before the pandemic.In 2019, total employment in Ontario stood at
7.377 million employed persons.In 2020
it fell to an annualized 7.022 million. As of June 2021, the most recent numbers
suggest that at 7.273 million, we are still not there yet.
And, try getting anything done.Employment and labour force participation have
both shrunk. The labour shortage which has been underway due to the aging of the population has been made worse with the shutdown and withdrawal of labour not to mention the reduced immigration of the last year. Indeed, if Thunder Bay is
any indicator, trying to get anything done in terms of household repairs and
services is very difficult. Everyone is booked and prices have gone up.Thunder Bay was always a difficult place to
get things done without a bevy of personal connections often acquired in high
school and the problems seem to have become worse in the wake of the
pandemic.
Yet the recovery continues, but much depends on what happens
next with the pandemic.The summer is a
golden time and for the post-pandemic recovery to continue beyond September vaccination rates must continue to rise.With new variants percolating around the world and travel resuming,
getting total double vaccination rates above 80 percent is crucial.September and the return to more indoor activity
will be an important test as to whether or not we really have got things under control.
While it is important to relax restrictions as normalcy
returns there is one restriction that should be maintained for the remainder of
the summer and into the fall and it should be a very simple one – if you are in
an indoor public space, you must wear a mask.It is true other provinces are already moving away from this but in my
opinion this is premature.I think you
can probably open everything up for indoor activity – gyms, theaters, dining etc…
with fairly generous capacity constraints but the one thing that should be maintained
is a face mask particularly this fall. Even in a restaurant, except at your table with your
designated dining partner or party, there needs to be a face mask on the way in
and as soon as you leave your table with servers always masked.It’s a simple rule and one with the greatest
benefits in preventing a resurgence until the vaccination rates are much
higher.
Whether we are up to this final task or plan to throw this
modest caution to the winds remains to be seen.
Statistics Canada's April 2021 Labour Force survey results show the employment effects of the third wave lock-downs in Canada and Ontario. Indeed, of the 207,000 jobs lost in Canada between March and April, about three quarters (153,000) were in Ontario with a sizeable portion of the losses amongst youth (73,000). and in Toronto (53,000). However, the monthly numbers obscure the fact that for the most part, there has been an employment recovery underway in Ontario. From a peak of 7,487,300 jobs in February of 2020, employment in Ontario fell 13 percent to bottom out at 6,497,300 in June of 2020 before starting to rise again and as of April 2021 stood at 7,256,500 jobs. However, this employment level is still nearly 231,000 jobs below the February 2020 employment peak.
Based on the April numbers, year over year we are up 257,000 jobs or about 3.7 percent. The accompanying figure plots major Ontario urban centers and Ontario as a whole in terms of the ranked percentage employment gains from April 2020 to April 2021. It also includes the percentage change from February 2020 to April 2020. Peterborough, Windsor and Brantford, have seen the largest percent employment gains over the course of the last twelve months. Indeed, if one goes back to February 2020, Peterborough is up 5,000 jobs from the February employment peak - or nearly 9 percent. Brantford is also up from its February peak as are Guelph and London.
Everyone else is still below where they were in February of 2020. The worst year over year performances are in Sudbury, Oshawa and Barrie, which range from a 0 percent increase to a six percent drop. Indeed, Barrie is down over 15,000 jobs since February of 2020 for a total drop of 12 percent. Barrie's recovery appears to have peaked in August of 2021 and has come down in employment terms since.
And of course, there is the biggest job engine of them all - Toronto. Here the year over year April numbers are up 2.2 percent - for an increase of 70,600 jobs but Toronto is still down 180,000 jobs from its February 2020 peak. So, nearly a year and a half into the pandemic, Ontario is still hurting with Toronto the largest source of missing jobs.
Like just about everywhere else in the world, Ontario was
hit hard by the job losses that resulted from the assorted lock-downs and coronavirus
containment strategies of the COVID-19 pandemic.Figure 1 presents seasonally adjusted monthly
employment data from Statistics Canada for Ontario from 2006 to the present. From February 2020 to June 2020, Ontario lost 990,000 jobs or 13.2 percent of
its employment. These losses, however, were not uniform in size across the
major urban centers of the province.
Figure 2 plots the ranked employment losses from the start
of the pandemic in February when the monthly employment losses began to June
2020 when the rebound begins and going from worst to best performers.Hardest hit with a 25 percent drop in
employment was Belleville, followed by Windsor at 18 percent and then Thunder
Bay at 16 percent. The three lightest hit cities were Ottawa with a 10 percent
drop, Brantford at 7 percent and Guelph at just below 7 percent.
With the exception of Barrie, all of these cities have
managed to bounce back since June as Figure 3 illustrates.The largest rebound as was the largest drop happened in Belleville.Belleville saw employment
rise 25 percent and was followed by London at 16 percent and Kingston at 15
percent.The smallest rebounds aside
from Barrie which appears to have continued to shrink were Guelph at 6 percent,
Sudbury at 5 percent and St. Catharines-Niagara at 4.5 percent.
Despite the rebound, only two of these urban areas have managed
to recover enough employment to be at more employment than the start of the
pandemic drop in February – Kingston and London – though not by much.Others still have a gap and it varies
substantially.Ontario as a whole is currently at
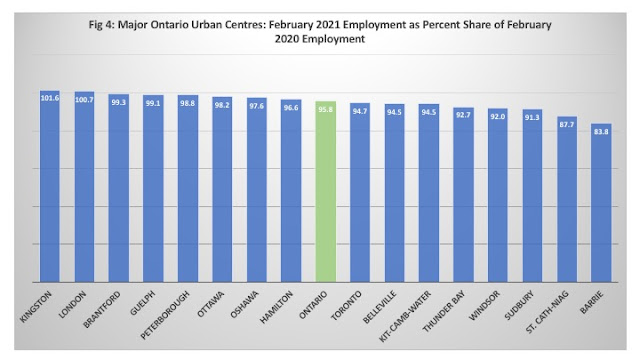
about 96 percent of its February 2020 level of employment. Figure 4 ranks the
cities by their employment in February 2021 as a percentage share of their
February 2020 employment.Thunder Bay,
Windsor, Sudbury, St. Catharines-Niagara and Barrie have recovered the least.Thunder Bay is only at 93 percent of its pre
pandemic level of employment followed by Windsor at 92 percent, Sudbury at 91
percent, St. Catharines at 88 percent and Barrie at 84 percent.On the other hand, after Kingston and London,
Brantford and Guelph are at just over 99 percent of pre-pandemic employment.
Overall, Ontario has seen a remarkable 12 months with
massive employment losses and a rather large rebound, but which only puts it
back at about 2018 levels in terms of employment.There is still a lot of recovery to go.
The Covid-19 pandemic has come with a huge cost in terms of
employment loss with the retail, food and accommodation, and travel sectors
exceptionally hard hit.The employment
impact in Ontario has been substantial also with total employment falling about
13 percent from February 2020 to June of 2020.The rebound since June has been insufficient to make up all the
employment losses and as of September total employment in Ontario was still
about 6 percent lower than February 2020.The impact has also varied
across major cities in Ontario with Kitchener-Waterloo, Thunder Bay and
Peterborough and Hamilton hit the hardest whereas Guelph, Brantford, Oshawa and
London experienced softer blows.
The composition of employment seems to be a factor and this
post drills down a bit into the employment composition by broad industry sector
– goods and services. The goods sector consists of employment in agriculture,
resources, utilities and oil and gas, construction and manufacturing.
Everything else ranging from wholesale and retail trade and transport, finance
and real estate, health and education to food and accommodation and public
administration are the services.
Figure 1 plots the composition of employment across these
two industry sectors for three cities in Ontario: Hamilton, Thunder Bay and
Guelph. What is quite interesting is despite their industrial, agricultural and
resource extraction histories, Hamilton, Guelph, and Thunder Bay, are now all remarkably
service intensive - part of the trend everywhere in high income economies. Hamilton’s goods
production sector accounts for 21 percent of employment whereas Thunder Bay is
the lowest of the three cities at 17 percent.However, Guelph on the other hand still has a relatively large share of
employment in goods production at 27 percent.
Figures 2 and 3 plot the percentage change in employment for
total, goods, and service sector employment for the three cities for two
periods: the onset of the pandemic between January 2020 to May 2020 and the
period of employment recovery as the first wave was brought under control from
May 2020 to September 2020.The data is
non-seasonally adjusted three-month average monthly employment data from
Statistics Canada.
From January to May, all three cities saw a drop in monthly
employment, but Guelph was hit half as hard with a drop of about 6 percent
compared to more than twice that for both Hamilton and Thunder Bay.What is also interesting is the employment
hit was harder in Guelph for the goods sector with a 25 percent employment drop
compared to 17 percent for Thunder Bay and 13 percent for Hamilton.However, service employment dropped about 13
percent in both Hamilton and Thunder Bay during the first wave of the pandemic,
but Guelph’s was essentially stable.
As for the recovery period from the first wave from May to
September, all three cities saw employment grow: 4 percent for Hamilton, 9
percent for Thunder Bay and 8 percent for Guelph.The performance across sectors is more
interesting.Employment in Guelph’s goods
sector rebounded robustly growing 57 percent compared to only 21 percent in
Hamilton and 26 percent in Thunder Bay.Construction was the major source of the rebound in all three cities but
manufacturing reinforced the rebound in Guelph whereas in Thunder Bay
manufacturing employment continued to decline even from May to September.Services did not recover as well as goods
production in all three cities with Guelph actually seeing some service sector
employment losses from May to September.For whatever reason, the service sector job losses in Guelph were
delayed compared to the other two cities.
What explains this?Good question but one cannot help but wonder if the CERB played a
role.On average, foods sector jobs are higher
paying than service sector ones though where the service jobs are is important-
for example, retail and food and accommodation versus health and
education.The CERB kicks in during the
pandemic and millions took advantage of it over the summer and into the early
fall.The CERB and its income support may
have provided more of a disincentive to return. Having a large goods production
sector relative to service sector did not insulate against employment loss in
the first wave of the pandemic but may have slowed the rebound in the presence
of the CERB.
Ontario’s economy has been hit hard by the Covid-19
pandemic.Seasonally adjusted monthly
employment in Ontario between February 2020 and September 2020 fell 6.3 percent
- from 7,551,900 jobs to 7,077,600 jobs.However, as illustrated in my last post, the employment drop varied
across its CMAs. The worst hit CMAs
are Kitchener-Waterloo-Cambridge and Thunder Bay - which saw declines of 11.2
and 9.2 percent respectively while at the other end are Guelph and Brantford,
which despite early losses have now recovered and in the case of Guelph even seen
a small increase.The question of course
is what might account for this variable performance?
One’s first thought is that it is the result of the impact
of Covid-19 with cities harder hit by the virus getting a bigger employment
wallop.However, a plot of the percent
change in employment levels across Ontario’s 15 largest CMAs from February 2020
to September 2020 (Figure 1) against Covid-19 cases per million population as
of mid-October show only a slight relationship between more negative employment
growth and higher case counts.
Can the effect of Covid-19 on employment depend on a
community’s employment structure?For
example, are communities more dependent on occupations in health, social
services, education and public administration (HSEP)– which are mainly broader public sector
jobs – more insulated from employment effects of Covid-19?Figure 2 illustrates this relationship for
Ontario’s 15 largest CMAs and again there really is not much of a
relationship.Indeed, outside of Ottawa,
Kingston and Thunder Bay have the largest HSEP shares in Ontario at 42 and 37
percent respectively and they are not exactly coasting. And, if one looks at
the share of employment in food and accommodation services (not shown) it is
also a pretty flat curve.Indeed, the
employment drop across CMAs seems to be impervious to being more service intensive as well
as the specific effects of Covid-19.
However, there is one more figure that is worth considering.
Figure 3 plots the percent of employment in manufacturing against the
percentage change in employment. What is interesting here is that the relationship
is a positively sloping one – that is, on average, larger employment shares in
manufacturing seem to be associated with a smaller employment drop over the
February to September period.It is of
course by no means an ironclad relationship. Kitchener-Cambridge-Waterloo, for example has
a manufacturing employment share of 17 percent but nevertheless experienced the
largest employment drop of the 15 CMAs at 11 percent.
However, the four CMAs with the largest manufacturing
employment share are Windsor (23%), Brantford (19%), Guelph (19%) and
Kitchener-Cambridge-Waterloo (17%).They
average 19.4 percent in manufacturing as a share of employment and their
average employment drop was 4.5 percent.Meanwhile, the four cities with the lowest manufacturing employment
share are Thunder Bay (6%), Kingston (5%), Sudbury (3%), and Ottawa (2%). They
averaged a manufacturing employment share at approximately 4 percent, but an
average drop in employment of 7 percent. What is it about manufacturing that may
insulate your economy more from Covid-19 related employment drops over the longer term?
Good question. Obviously, it is easier to shut down things
are deemed non-essential such as personal services and perhaps even some
broader public sector service activities.Moreover, some of these sectors are relatively low-paying and the fairly
generous CERB payments probably more attractive than returning to work.These are very labour-intensive activities
and when hit hard can generate a lot of employment losses.On the other hand, manufacturing – especially
advanced manufacturing – is already quite capital intensive so it is relatively
more difficult to shed employment.Moreover,
once the economy reopened – it was things that were needed be they masks or
toilet paper or metal products – and production resumed as quickly as possible.
And, manufacturing is much higher paying making staying on the CERB less
attractive.
The relative robustness of employment in the Covid-19 era as
a result of manufacturing intensiveness may have global implications for economic
recovery.Economies around
the world have been hit hard with large drops in GDP and employment. However,
many countries over the last few decades have seen an evolution of their
economies away from goods production and towards services.The G-7 countries certainly are in this category.This means countries that are currently more
manufacturing intensive will likely do much better in the short to medium term
especially if they are producing goods in high demand.
This also explains China’s seemingly robust economic recovery.Given that so much of the world’s
manufacturing has relocated to China over the last two decades, they are poised
to dominate economic recovery over the next couple of years.China’s success however may be fragile.
First, their longer-term export success requires that other economies recover.Being a mercantilist means you want to expand
your national economy and power by exporting high value-added products and
importing low value-added items.However, having your export markets devastated by Covid-19 is going to
be bad for business. Second, most other countries are about to embark on a
manufacturing repatriation program as they realize that having a mercantilist
and authoritarian country with a monopoly on goods production does place your
supply chain at risk and ultimately your national economic welfare.
The economic impact of Covid-19 has affected output and employment in economies around the world and of course, Ontario is no exception. However, just as the economic impact varies across countries around the world, so does it vary within countries and within regions. Seasonally adjusted monthly employment in Ontario between February 2020 and September 2020 has fallen from 7,551,900 jobs to 7,077,600 jobs - a percentage drop in employment of 6.3 percent. The drop was steepest from February to June - which saw a drop of 13 percent but the rebound since has recovered some but not all of the jobs lost.
The accompanying figure plots the percentage change in employment level for the province along with its major CMAs during this eight month period of the pandemic for which Statistics Canada has released the seasonally adjusted monthly employment numbers. The results are interesting. The worst hit CMAs are Kitchener-Waterloo-Cambridge and Thunder Bay - which saw declines of 11.2 and 9.2 percent respectively. At the other extreme are Guelph and Brantford, which have now recovered all of their lost employment and in the case of Guelph seen a small increase.
There is no apparent pattern to the impact of employment losses based on the impact of COVID. Thunder Bay had a very mild impact from Covid-19 in terms of cases and mortality (to date Thunder Bay District is at a total of 114 cases and one death - one of the lowest rates in the province given a population of about 140,000) and yet it had the second highest percentage employment losses. Toronto and Ottawahave had higher rates incidence and mortality compared to Hamilton and yet are in the middle of the pack in terms of employment losses while Hamilton has done worse than they have The employment losses really make little sense in terms of the impact of the virus.
There also seems to be no obvious patterns in terms of location.The hardest hit in terms of employment losses are in northern Ontario, the Golden Horseshoe, central Ontario and eastern Ontario. The smallest hits are in central Ontario, eastern Ontario and southwestern Ontario. Good and bad performance is spread everywhere which brings us to perhaps factors such as local response to the pandemic by employers and health authorities as well as composition of the local economy.
Were some communities quicker to implement lock downs and shutdowns and with more stringent rules and slower return to work? The case of the two northern Ontario CMAs may be a case in point given the share share of public sector employment in those cities and yet their poorer employment performance.
The Kitchener-Waterloo area is exceptionally dependent on students
and the businesses servicing those students so maybe that is a factor. A detailed look at the restaurant, accommodation, hospitality, recreation and cultural/entertainment shares of local employment may also yield insight into why some CMAs did so poorly relative to others given these sectors were exceptionally hard hit. Of course, as we move into winter one grows concerned that additional impacts on these sectors may have permanent long-term effects.
Until we drill down into more detailed data, the differential impact is a bit of a puzzle.
As the
lock downs end and Ontario embarks through various stages of reopening, the
expectation is that unemployment will decline.Between January 2020 and June 2020. Total employment in Ontario fell
from 7,453,900 to 6,883,100 jobs -a
drop of 7.7 percent.The labour force –
those willing, able and looking for work over the same period shrank slightly
by 0.3 percent while the unemployment rate more than doubled from 5.2 to 12.3
percent.The participation rate – the share
of population aged 15 years and over – declined slightly from 64.2 to 63.7
percent while the employment rate fell sharply from 60.8 to 55.9 percent.
The
employment rate is perhaps the best measure of engagement with the labour
market as it is the share of the adult population that has a job.The unemployment rate, on the other hand, is
affected by not just the number of unemployed but also the size of the labour
force.One can have the number of
unemployed stay the same but the unemployment rate fall if the labour force shrinks.
While the
fall in the unemployment rate is perceived as a key indicator of economic recovery
from COVID-19, if people who lost their jobs never come back into the labour
force, then the recovery picture may look better than it is.What is more interesting is whether the
employment rate rebounds.As the accompanying
figure shows, for most CMAs in Ontario, there does not appear to be a strong
bounce back in the employment rate.Most
analysts think the economy essentially bottomed out in April/May and June
should see the start of recovery.
As the
accompanying Figure 1 shows, the June employment rate is up from May in
Kingston, Peterborough, St. Catharines-Niagara, Brantford, London, Windsor and
Barrie.It has either stayed the same or
declined further in Ottawa, Oshawa, Toronto, Hamilton, Kitchener-Cambridge-Waterloo,
Guelph, Greater Sudbury and Thunder Bay.At first glance, It does seem that the closer you are to the GTA, the
more likely the depressed employment rate in June persists with Ottawa in its
own bubble. The GTA and Ottawa are the most urbanized areas and the pandemic has been especially hard on high population density areas. However, if that is the
case, one should also expect to see a bounce back in the areas furthest from
the GTA area – namely, low density Thunder Bay and Sudbury – which is not the case.
When you
looked at the ranked percent change in the employment rate (Figure 2), Thunder
Bay and Sudbury look more like areas adjacent to the GTA core rather than
southern Ontario areas outside the GTA core.Another case of northern exceptionalism I guess.One suspects that either Thunder Bay and
Sudbury are more closely tied to the GTA economy than one might think or some
other factor may be inhibiting or delaying their employment rebound.
The April 2020 labour force numbers are out from Statistics Canada and the numbers are indeed grim. Employment dropped by one million in March, and fell by
nearly two million in April, bringing the total employment decline since
the beginning of the COVID-19 economic shutdown to over three million. In addition, the number of people who were employed but worked less than half of their usual hours for reasons related to COVID-19 increased by 2.5 million from February to April.
Statistics Canada noted - and this was picked by by the media - that the size of the decline in employment since February (-15.7%)
far exceeds declines observed in the 1981-1982 recession which resulted in a total employment decline
of 612,000 (-5.4%) over approximately 17 months. However, the national unemployment rate in April 2020 is what the unemployment was like at the peak of the 1981-82 recession - at 13 percent. Employment and the labour force have grown substantially over the last 40 years making such comparisons of absolute numbers problematic. Nevertheless, the increase in unemployment rates and the percentage declines in employment are dramatic given that declines in previous recession were spread out over months while this one has happened in 30 days.
A comparison across CMAs is quite interesting. All of Canada's 35 CMAs saw an increase in their unemployment rates (3 month moving average) with the highest unemployment rates currently in Saguenay(13.1 percent), Windsor and Calgary. The lowest are in Victoria, Ottawa, and Abbostford-Mission (6.2 percent). Thunder Bay clocks in the middle of all this at 9.2 percent with Sudbury much lower at 8.9 percent.
As for employment declines in percentage terms, everyone saw their total employment decline relative to April 2019 - except for Barrie of all places. Even with the March to April drop of 6400 jobs, Barrie has been growing so robustly that its April 2020 total employment is still 5 percent higher than April 2019. However, the employment drops are quite steep especially for Peterborough and Windsor which saw their employment drop 17.7 and 15.8 percent respectively. Relatively unscathed - along with Barrie - are London, the Ontario portion of Ottawa-Gatineau, Trois Rivieres and Moncton. Thunder Bay is again close to the middle in terms of employment declines at -6.3 percent while Sudbury was -8.9 percent.
So, there you have it. The numbers will probably get worse before they get better. The numbers for May - which will come out in June - will probably show an increase in the unemployment rate as well as a further decline in employment. However, the additional declines should be substantially less. One can start to expect to see improvements in the employment numbers in June which will be reflected in July's release.